Submit an Article
Navigate
Home
Editorial Board
Editorial Policies
Current Volume
Archive
Scientific Integrity
Publication Ethics Statements
Interviews with Outstanding Authors
Newsroom
Sponsored Conferences
Podcast
Contact
Special Collections
Submit an Article
Online ISSN: 1945-4589
Research Paper
|
Volume 13, Issue 10
|
pp. 13954–13967
S100B
gene polymorphisms are associated with the S100B level and Alzheimer’s disease risk by altering the miRNA binding capacity
Back to article
Figure 1
(1 of 4)
−
100%
+
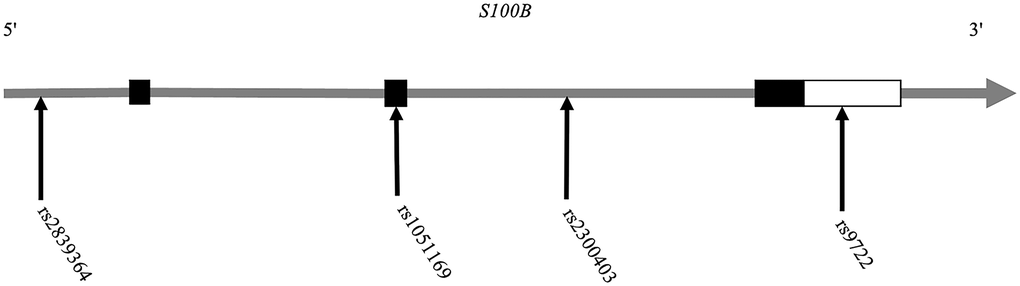
Figure 1.
Position distribution of the SNPs in the
S100B
gene.