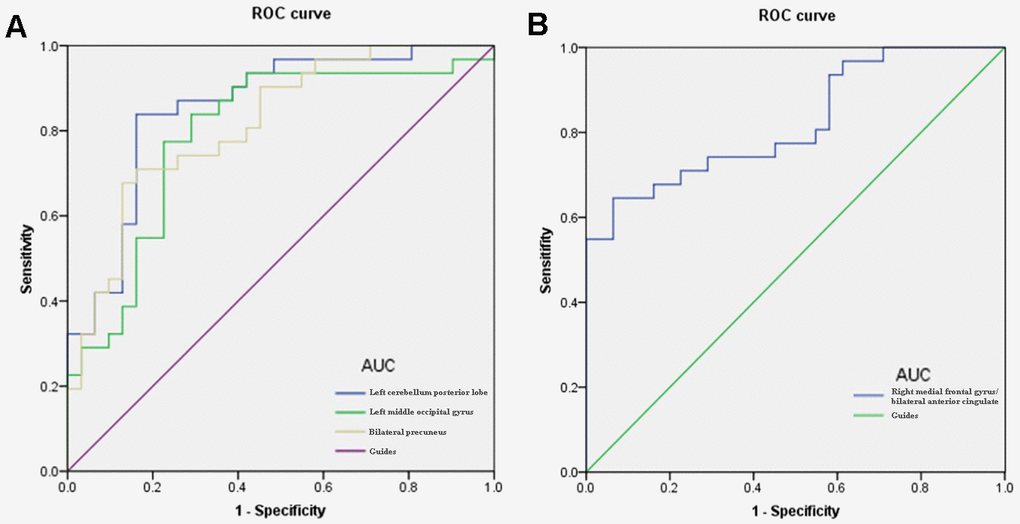
Figure 5.ROC curve analysis of the mean DC values for altered brain regions. Notes: (A) The area under the ROC curve were 0.855, (p<0.001; 95% CI: 0.760-0.951) for LCPL, LMOG 0.792 (p<0.001; 95% CI: 0.675-0.909), BP 0.816 (p<0.001; 95% CI: 0.711-0.920). (B) The area under the ROC curve was 0.822 (p<0.001; 95% CI: 0. 717-0.926) for RMFG/BAC. Abbreviations: DC, degree centrality; ROC, receiver operating characteristic; LCPL, left cerebellum posterior lobe; LMOG, left middle occipital gyrus; BP, bilateral precuneus; RMFG/BAC, right medial frontal gyrus/ bilateral anterior cingulate.