Submit an Article
Navigate
Home
Editorial Board
Editorial Policies
Current Volume
Archive
Scientific Integrity
Publication Ethics Statements
Interviews with Outstanding Authors
Newsroom
Sponsored Conferences
Podcast
Contact
Special Collections
Submit an Article
Online ISSN: 1945-4589
Research Paper
|
Volume 13, Issue 9
|
pp. 13153–13165
Identification of potential autophagy-associated lncRNA in prostate cancer
Back to article
Figure 4
(4 of 7)
−
100%
+
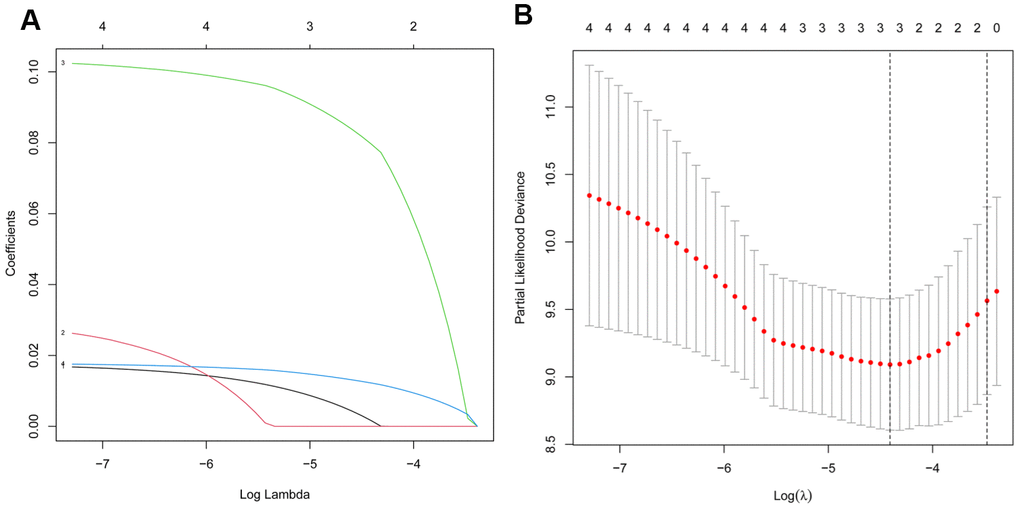
Figure 4.
Screening of the autophagy-associated lncRNA in prostate cancer by LASSO model.
(
A
) Plots of the cross-validation error rates. (
B
) LASSO coefficient profiles of the prognostic lncRNAs.