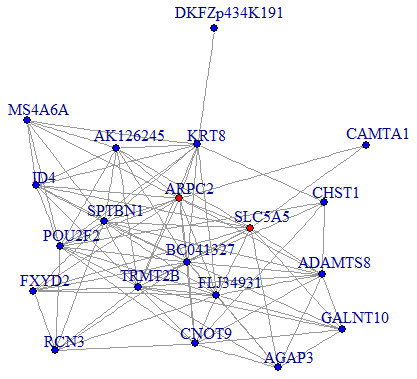
Figure 4.Co-expression subnetworks of SSD-associated genes. Nodes in the network represent genes, and edges represent significant co-expression (≥ 0.80) between two genes. Different colors indicate different strengths of co-expression. Genes colored in red are hub genes, and genes colored in blue are corresponding genes.