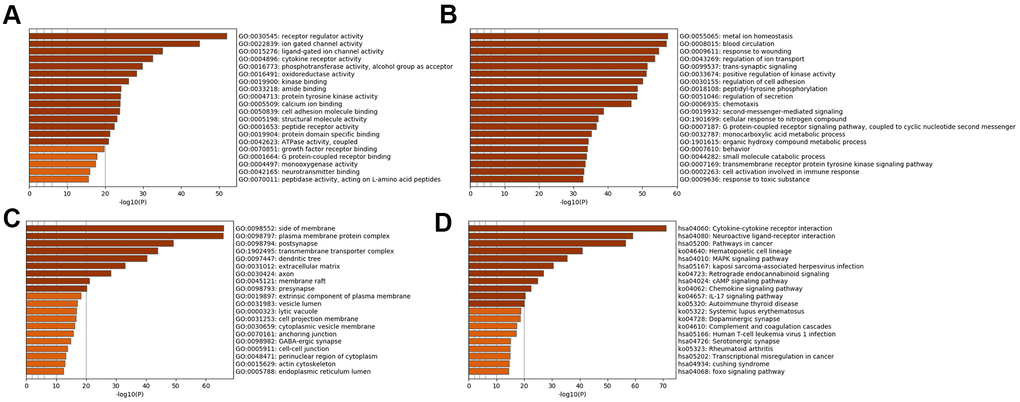
Figure 2.Bar graph of enriched terms across input SSD-specific genes, colored by p-values. Provided gene identifiers were first converted into corresponding H. sapiens Entrez gene IDs using the latest version of the database (last updated on 2020-09-16). If multiple identifiers corresponded to the same Entrez gene ID, they were considered as a single Entrez gene ID in downstream analyses. For each given gene list, pathway and process enrichment analyses were performed using the following ontology sources: (A) GO MFs; (B) GO BPs; (C) GO CCs; (D) KEGG pathways. All genes in the genome were used as the enrichment background. “Log10(P)” is the p-value in log base 10.