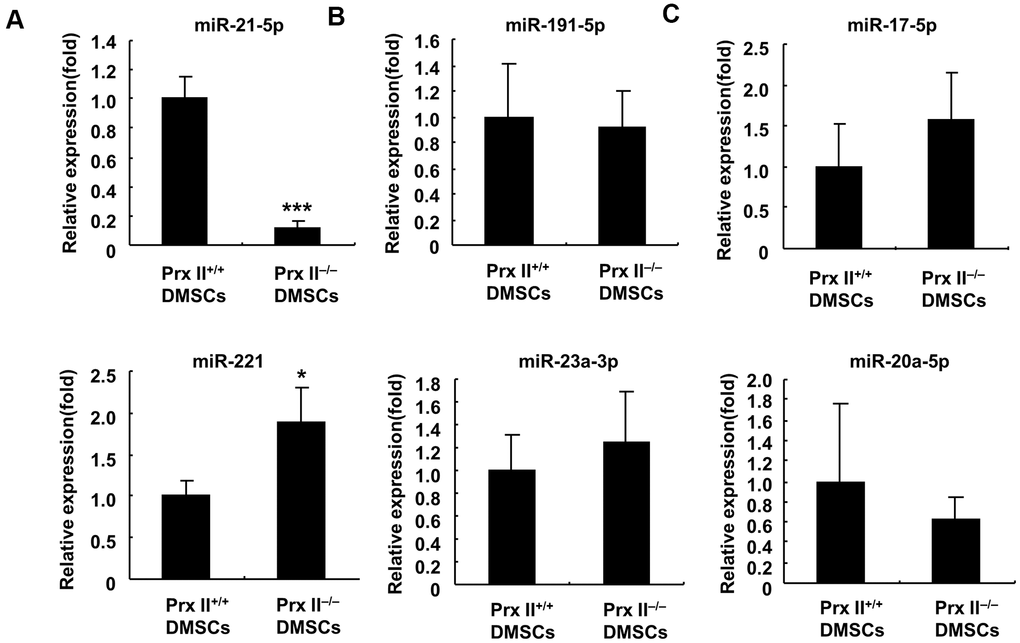
Figure 9.Analysis of miRNA expression in Prx II+/+ DMSCs and Prx II−/− DMSCs by RT-PCR. (A) Expression levels of miR-21-5p and miR-221. (B) Expression levels of miR-23a-3p and miR-191-5p. (C) Expression levels of miR-20a-5p and miR-17-5p. All data shown represent the mean ± SD (n = 6).