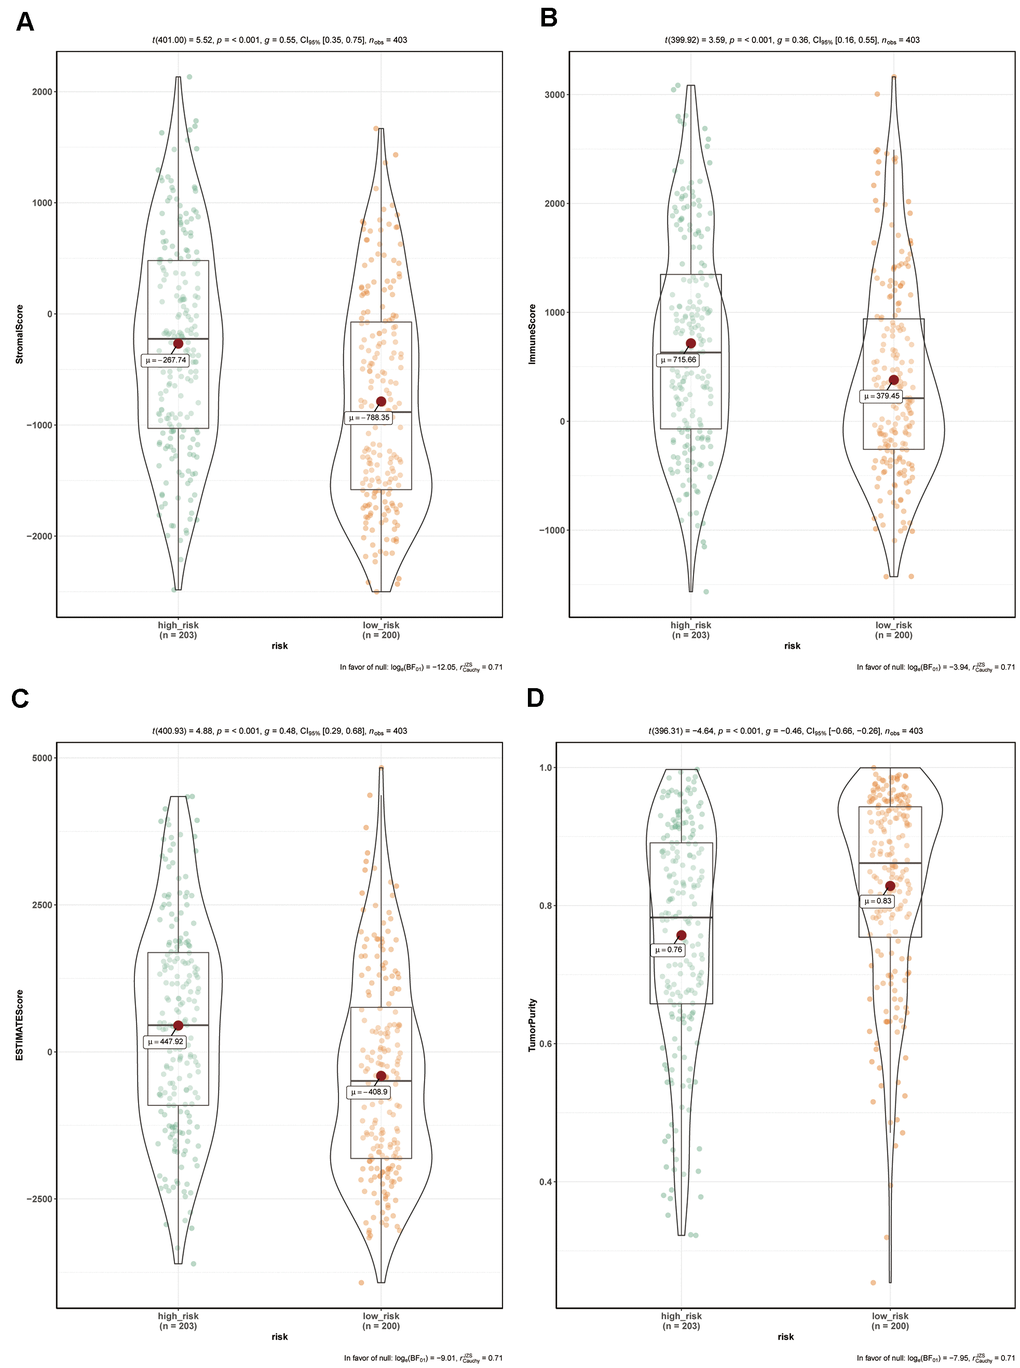
Figure 7.Comparison of tumor microenvironment composition between risk groups in the TCGA-BC cohort. (A) Comparison of stromal scores between risk groups (P<0.001). (B) Comparison of immune scores between risk groups (P<0.001). (C) Comparison of ESTIMATE scores between risk groups (P<0.001). (D) Comparison of tumor purity between risk groups (P<0.001).