Submit an Article
Navigate
Home
Editorial Board
Editorial Policies
Current Volume
Archive
Scientific Integrity
Publication Ethics Statements
Interviews with Outstanding Authors
Newsroom
Sponsored Conferences
Podcast
Contact
Special Collections
Submit an Article
Online ISSN: 1945-4589
Research Paper
|
Volume 13, Issue 10
|
pp. 13876–13897
Prognostic value of members of NFAT family for pan-cancer and a prediction model based on NFAT2 in bladder cancer
Back to article
Figure 3
(3 of 13)
−
100%
+
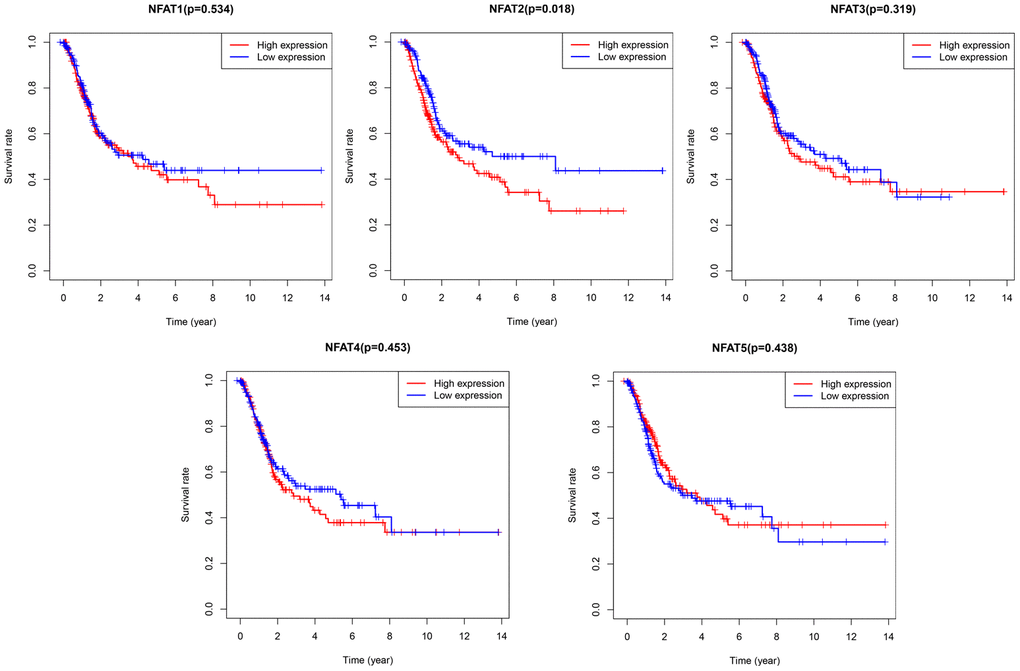
Figure 3.
Prognostic value of NFAT members in BLCA patients.
Kaplan-Meier survival curves for OS of BLCA patients with expression of NFAT1, NFAT2, NFAT3, NFAT4 and NFAT5.