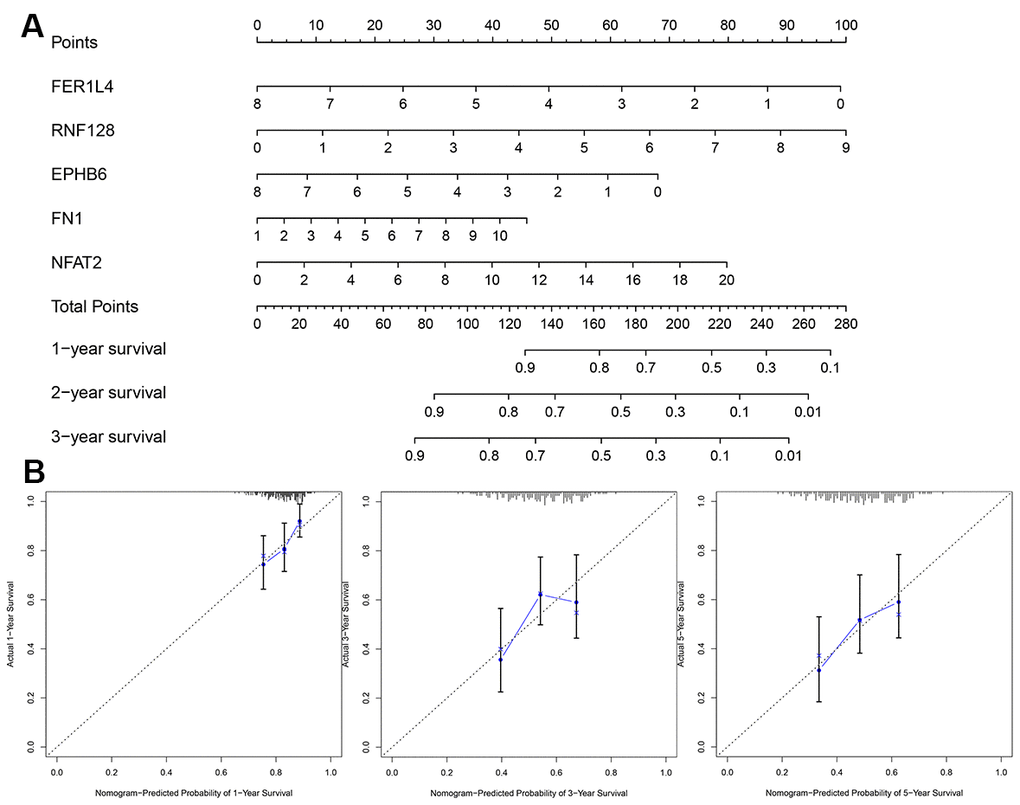
Figure 11.Evaluation of risk score model. (A) The nomogram is applied by adding up the points identified on the points scale for each variable. (B) The calibration curve for predicting 1-3-5 years OS for patients with BLCA. The Y-axis represents actual survival, as measured by K-M analysis, and the X-axis represents the nomogram-predicted survival (P<0.05).