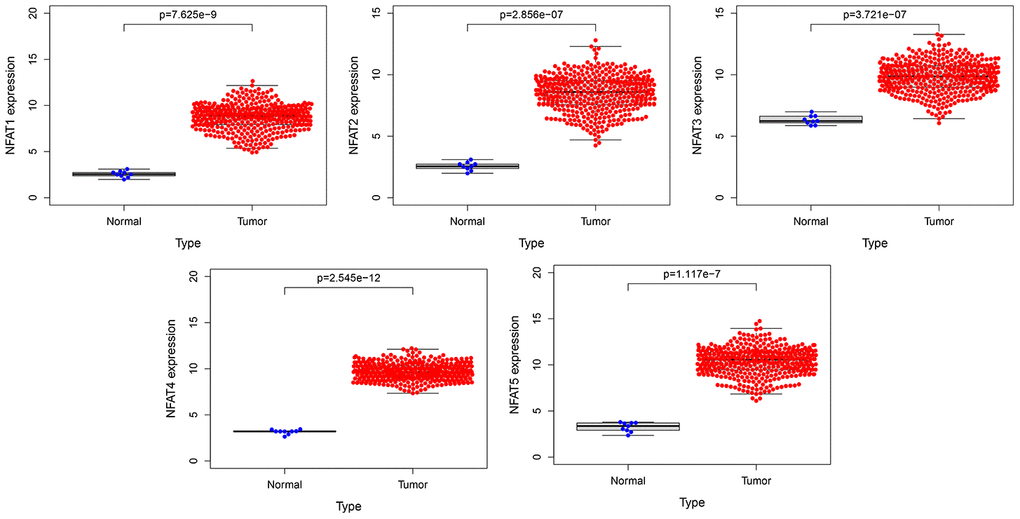
Figure 1.The expression of NFAT family gene in BLCA. Blue represents the expression of normal tissues in the GTEx database, and red represents the expression of BLCA patients in the TCGA database.
Figure 1 — Prognostic value of members of NFAT family for pan-cancer and a prediction model based on NFAT2 in bladder cancer | Aging