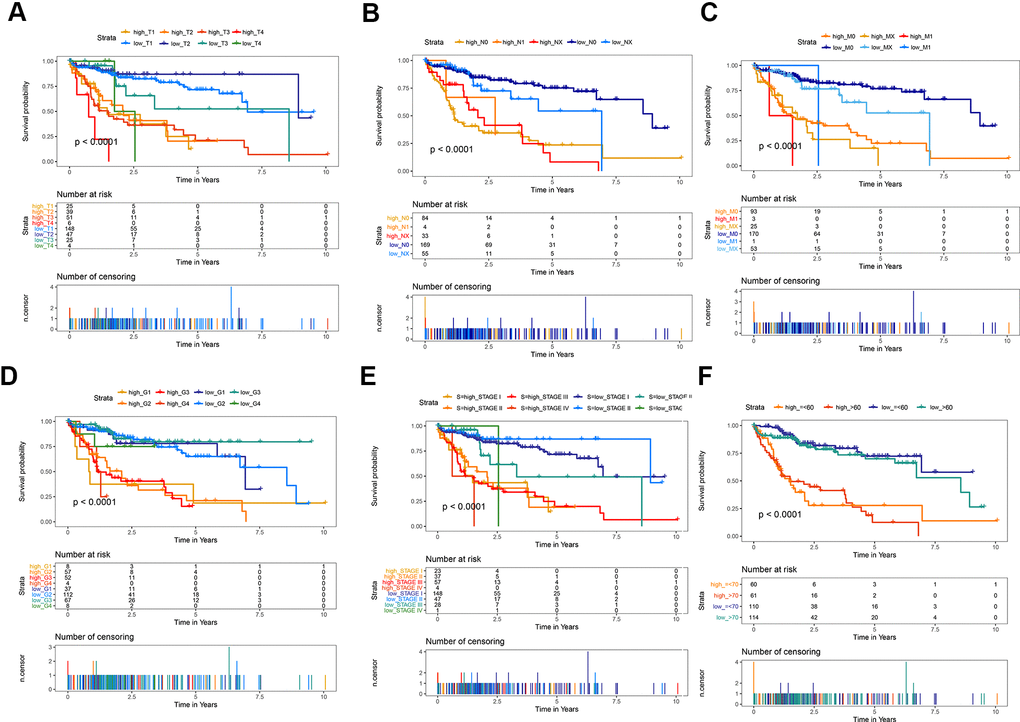
Figure 6.Kaplan-Meier survival analysis of the gene signature compared with clinical indicators. (A) T stage; (B) N stage; (C) M stage; (D) tumor grade; (E) AJCC stage; (F) Age.
Figure 6 — Development and validation of epithelial mesenchymal transition-related prognostic model for hepatocellular carcinoma | Aging