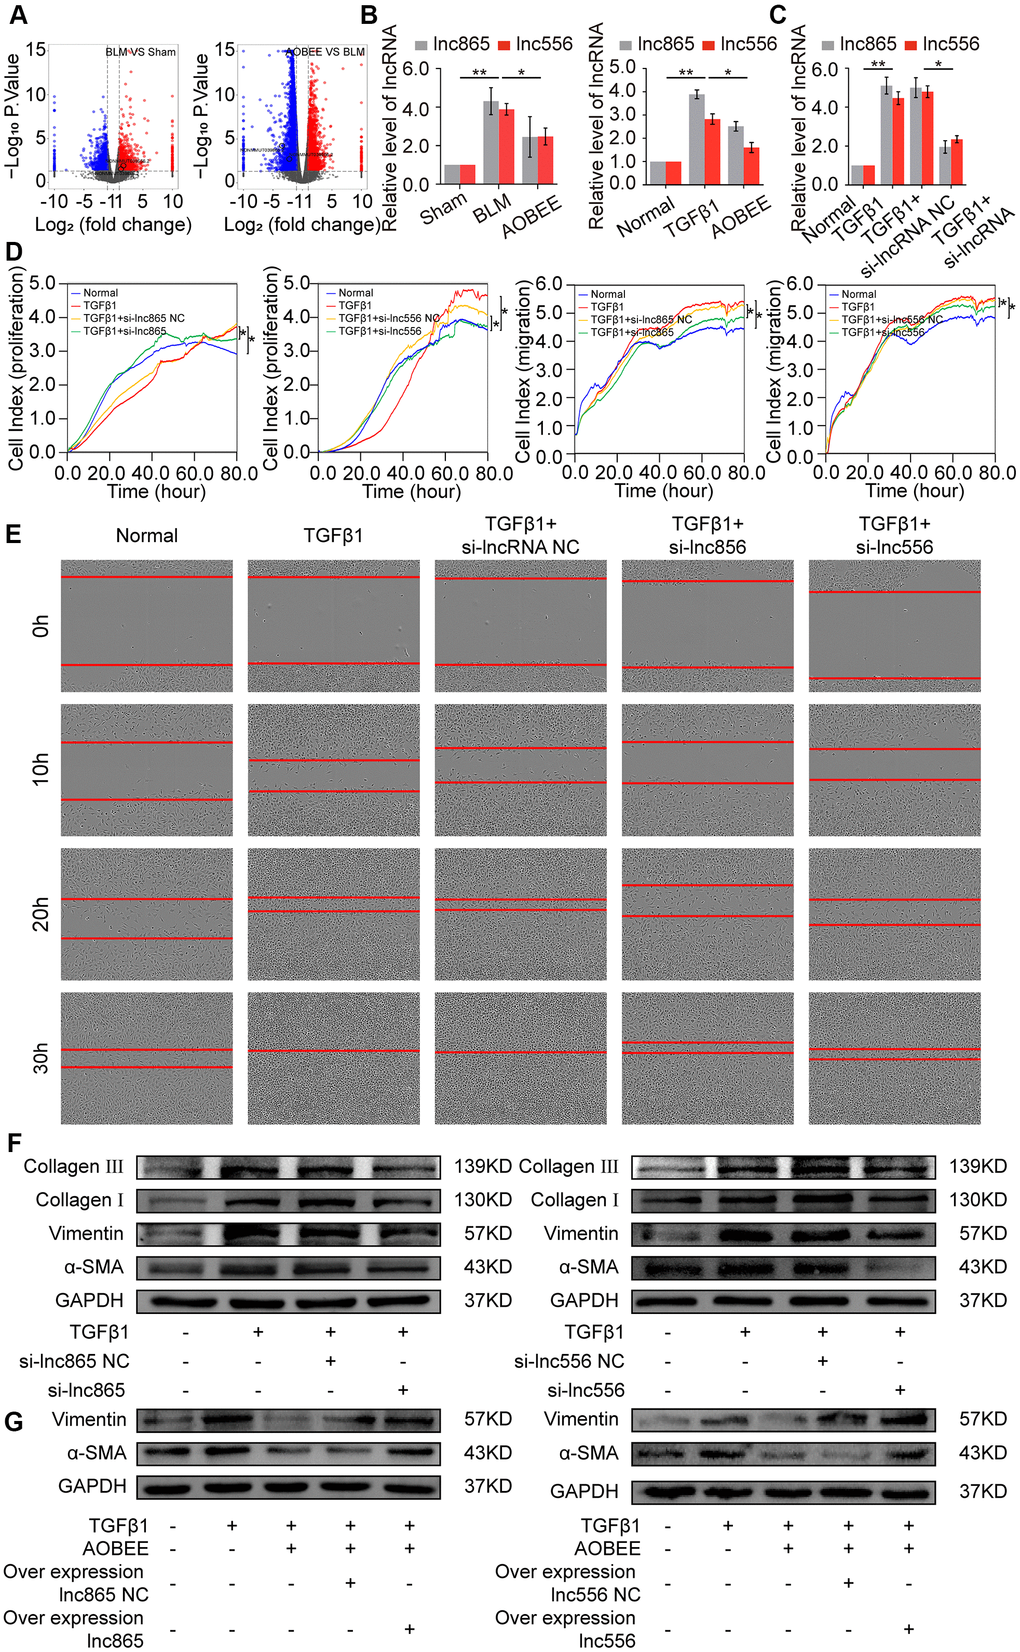
Figure 4.Inhibition of AOBEE on lnc865 and lnc556. (A) RNA sequencing demonstrated the differently expressed RNA transcriptions in BLM group compared with those in sham group (left), and in AOBEE + BLM group compared with those in BLM group (right). Lnc865 and lnc556 upregulated in BLM group compared with those in sham group, and downregulated in AOBEE + BLM group compared with those in BLM group. (B) qRT-PCR confirmed that BLM caused a marked increase of lnc865 and lnc556 expression, whereas AOBEE caused a marked decrease of their expression in BLM-treated mice and TGFβ1-induced L929 cells. (C) The efficacy of knockdown with si-lnc865 and si-lnc556 was examined through qRT-PCR. (D) The real-time cell proliferation and migration experiments indicated that si-lnc865 and si-lnc556 inhibited the proliferation and migration of cells activated by TGFβ1. (E) Images automatically monitored by an IncuCyte S3 instrument showed that si-lnc865 and si-lnc556 repressed the migration of L929 cells activated by TGFβ1 at different time points. (F) Expression levels of collagen, vimentin, and α-SMA were downregulated in the si-lnc865 and si-lnc556 groups compared with the TGFβ1-treated group. (G) The results of rescue experiment showed that AOBEE treatment reduced the expression of α-SMA, vimentin. Overexpression of lnc865 and lnc556 reversed this treatment effect. Each bar represents the mean ± SD, n = 6; *p < 0.05, **p < 0.01.