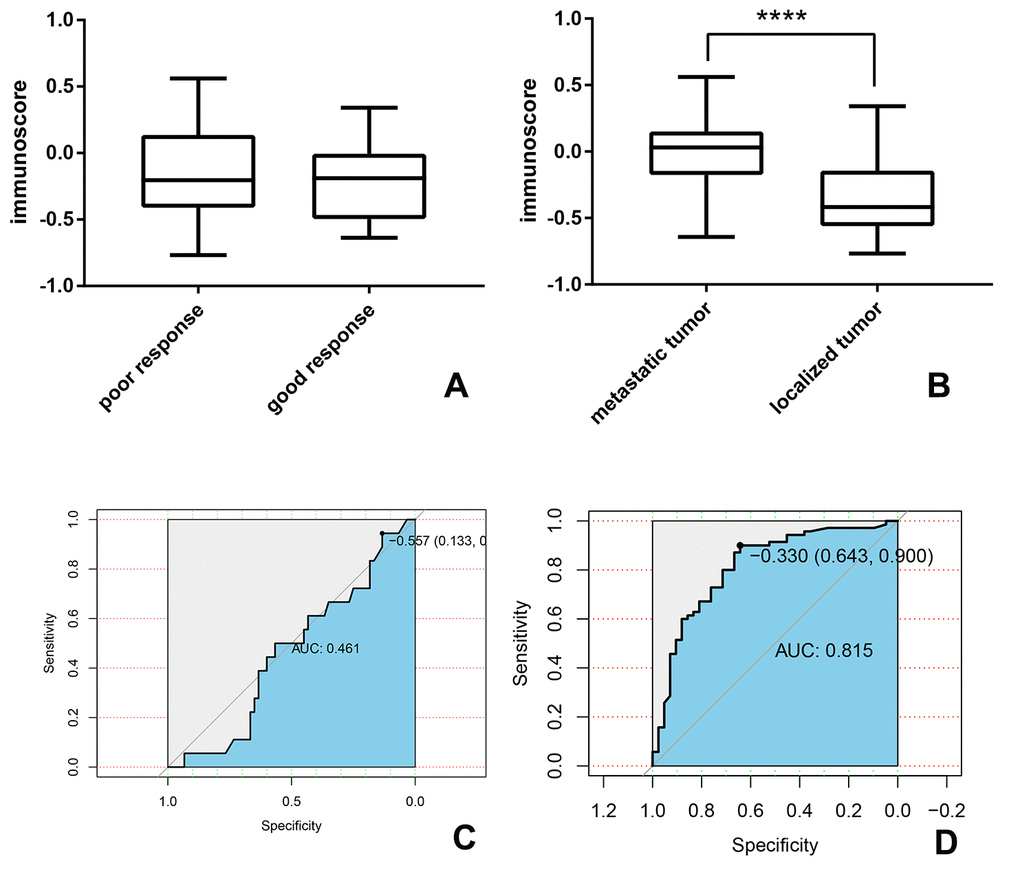
Figure 9.The association between immunoscore and metastasis and chemotherapy-resistant in the OS group. (A, B) the immunoscore of the patient with (A) good or poor response to chemotherapy (B) localized or metastatic tumor; (C, D) time-dependent receiver-operating characteristic (ROC) curves present the association between immunoscore and (C) chemotherapy-resistant (D) metastatic tumor.