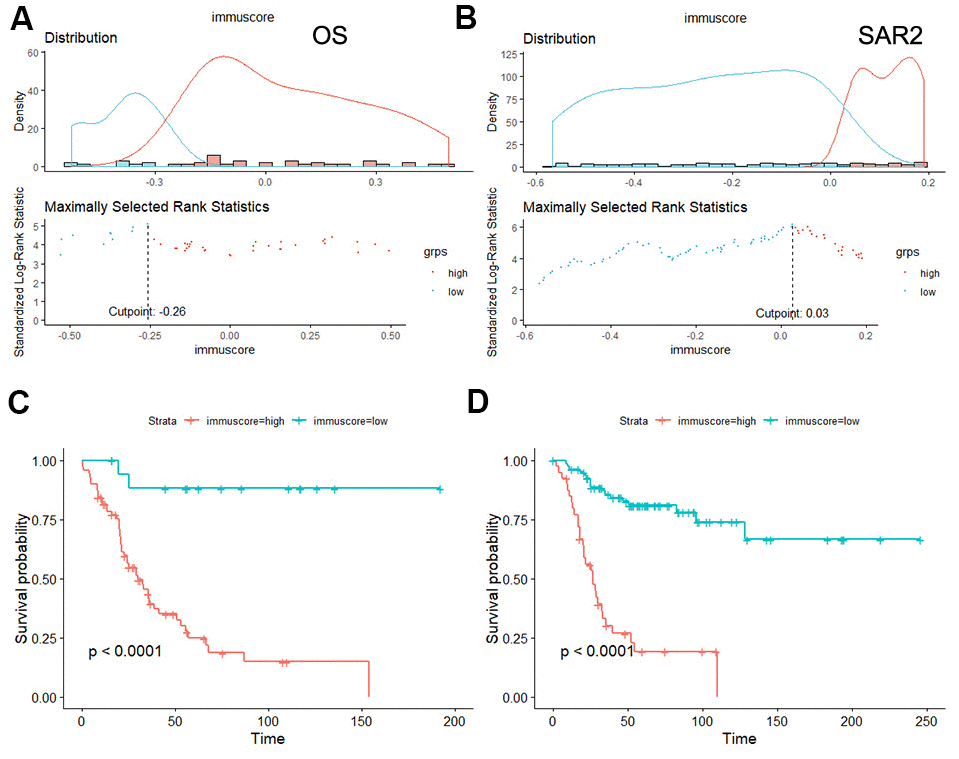
Submit an Article
Navigate
Home
Editorial Board
Editorial Policies
Current Volume
Archive
Scientific Integrity
Publication Ethics Statements
Interviews with Outstanding Authors
Newsroom
Sponsored Conferences
Podcast
Contact
Special Collections
Submit an Article
Online ISSN: 1945-4589
Research Paper
|
Volume 13, Issue 10
|
pp. 13708–13725
Gene expression profiles for an immunoscore model in bone and soft tissue sarcoma
Back to article
Figure 7
(7 of 9)
−
100%
+
Figure 7.
Survival analysis of the immunoscore in OS and SAR2.
(
A
,
B
) The distribution of immunoscore and the selection of cut-off point, (
A
) OS group, (
B
) SAR2 group; (
C
,
D
) Kaplan-Meier curves for overall survival by immunoscore group.