Submit an Article
Navigate
Home
Editorial Board
Editorial Policies
Current Volume
Archive
Scientific Integrity
Publication Ethics Statements
Interviews with Outstanding Authors
Newsroom
Sponsored Conferences
Podcast
Contact
Special Collections
Submit an Article
Online ISSN: 1945-4589
Research Paper
|
Volume 13, Issue 9
|
pp. 12833–12848
Predicting intraventricular hemorrhage growth with a machine learning-based, radiomics-clinical model
Back to article
Figure 1
(1 of 6)
−
100%
+
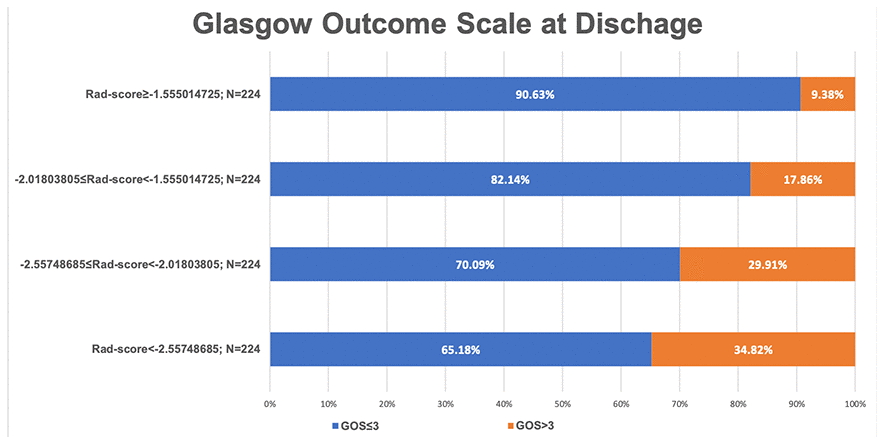
Figure 1.
A bar chart demonstrating the relationship between the Rad-score and glasgow outcome scale at discharge.