Submit an Article
Navigate
Home
Editorial Board
Editorial Policies
Current Volume
Archive
Scientific Integrity
Publication Ethics Statements
Interviews with Outstanding Authors
Newsroom
Sponsored Conferences
Podcast
Contact
Special Collections
Submit an Article
Online ISSN: 1945-4589
Research Paper
|
Volume 13, Issue 7
|
pp. 9277–9329
Multiomics integrative analysis identifies
APOE
allele-specific blood biomarkers associated to Alzheimer’s disease etiopathogenesis
Back to article
Figure 1
(1 of 7)
−
100%
+
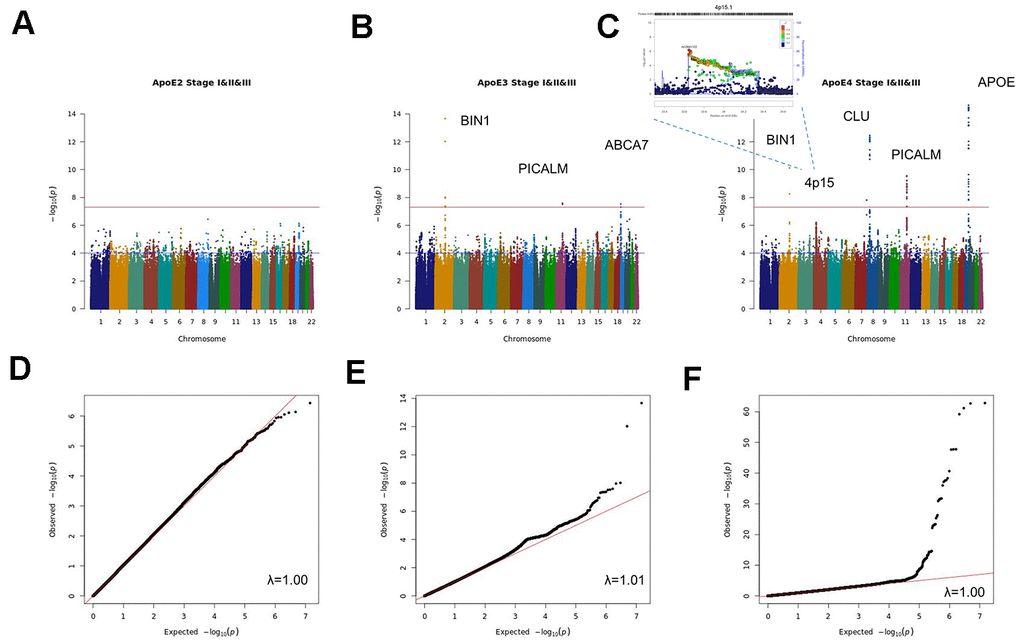
Figure 1.
Manhattan and QQ plots of stage I+II+III APOE2 (
A
,
D
), APOE3 (
B
,
E
) and APOE4 (
C
,
F
) stratified meta-analysis.