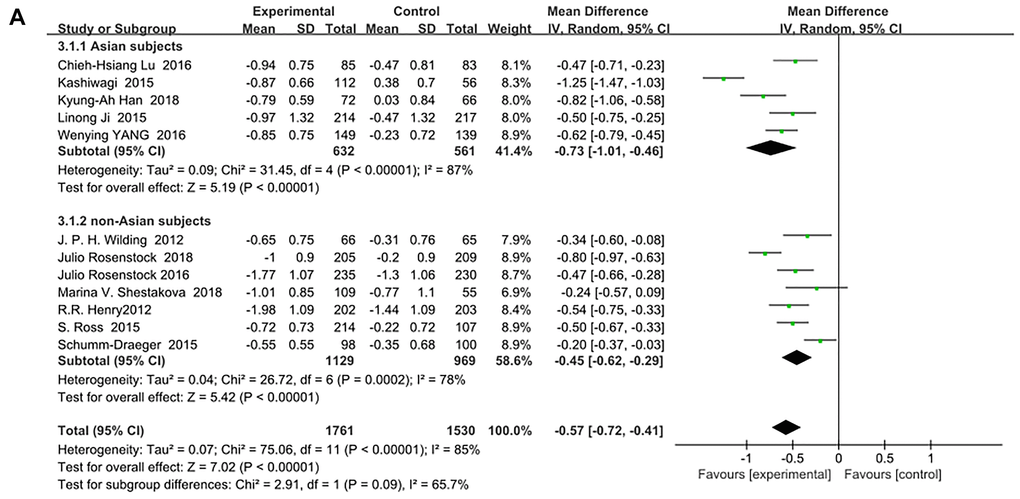
Figure 3A.Forest plot of the weighted mean difference in the change of HbA1c from baseline.
Figure 3A — The different hypoglycemic effects between East Asian and non-Asian type 2 diabetes patients when treated with SGLT-2 inhibitors as an add-on treatment for metformin: a systematic review and meta-analysis of randomized controlled trials | Aging