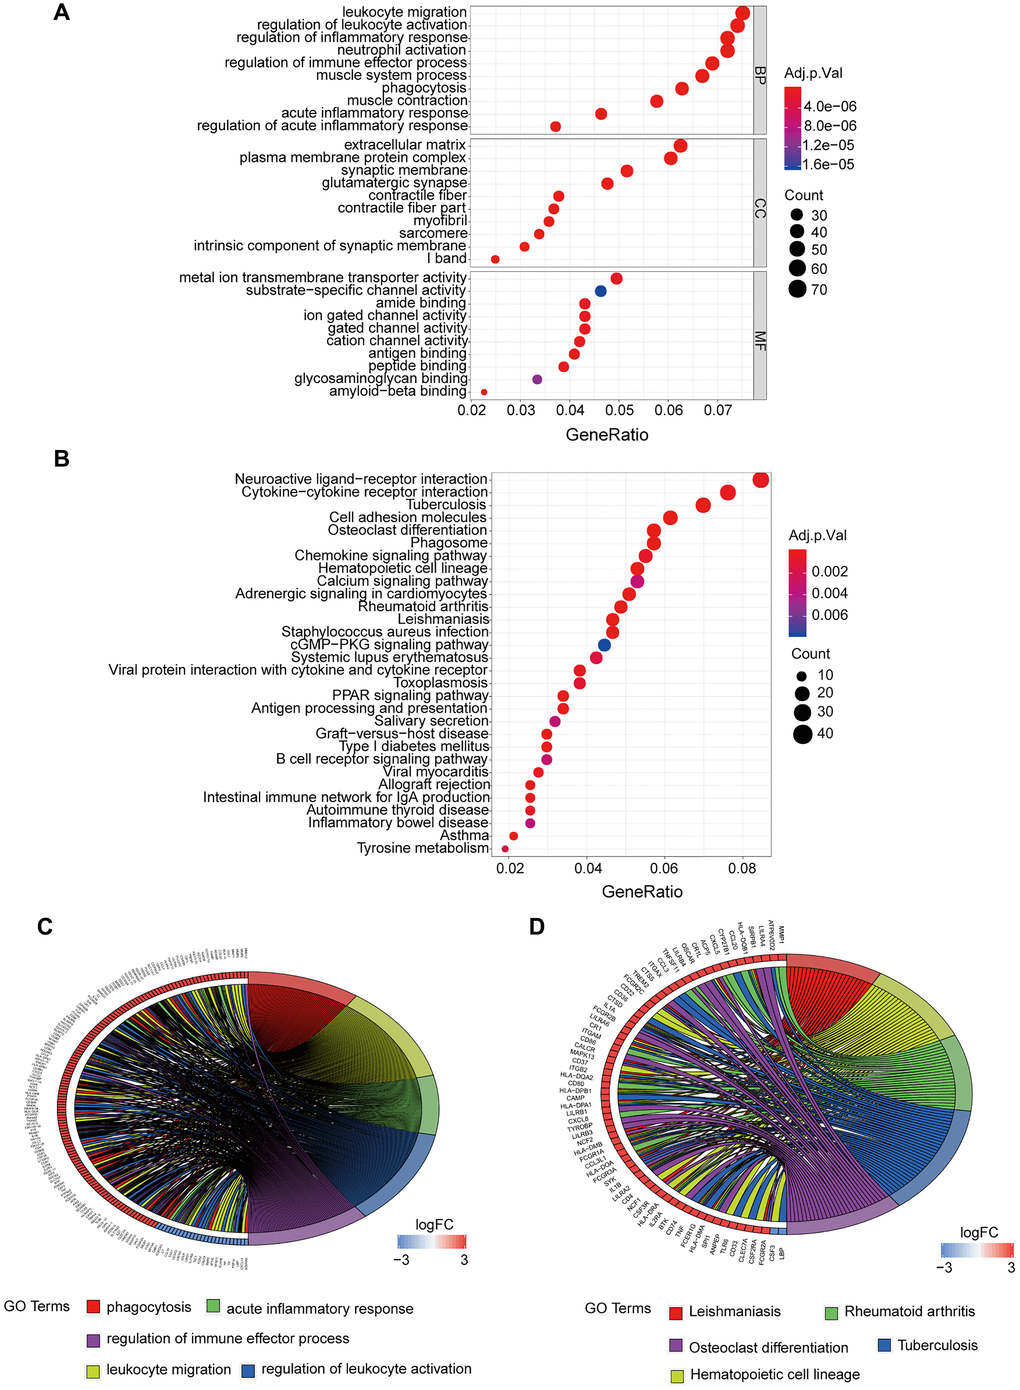
Figure 3.GO and KEGG enrichment analysis of DEGs. (A) GO enrichment analysis of DEGs, BP represents the biological process, CC represents the cellular component, and MF represents the molecular function. (B) KEGG pathway analysis of DEGs, adj.p.Val is corrected p-value, the count represents the number of DEGs. (C) Interaction between DEGs and top 5 terms of GO entries. (D) Interaction between DEGs and top 5 disease pathways in KEGG. DEGs: Differentially expressed genes. KEGG: Kyoto Encyclopedia of Genes and Genomes. FC: Fold change. Adj.p.Val: corrected p-value.