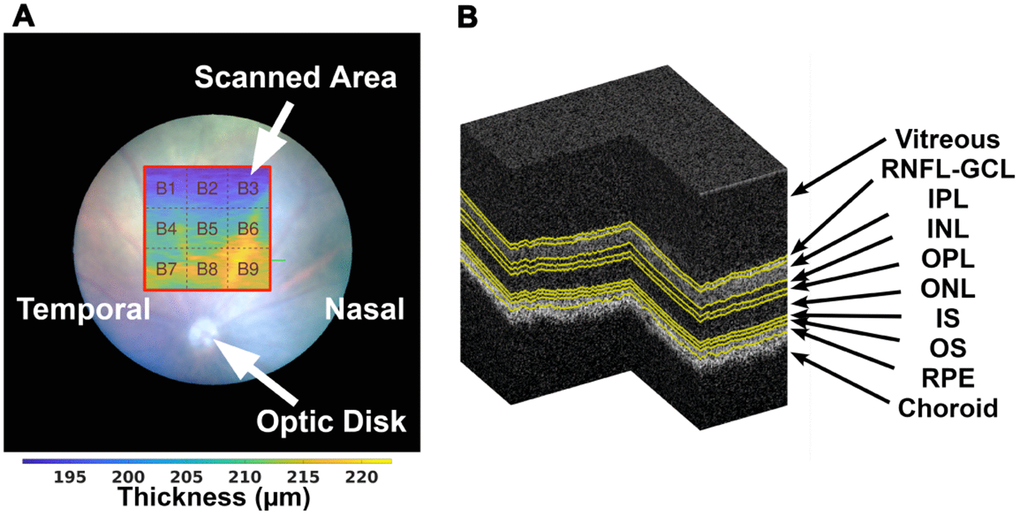
Figure 1.On the left (A), the illustration of the scanned area (with red border) with relation to the position of the optic disc, and division of the thickness maps into 3×3 blocks as addressed in section 2.5, over a TRT thickness map from a WT mouse at the age of one-month-old. A segmented OCT volume is shown on the right (B), where the various interfaces are presented in yellow.