Submit an Article
Navigate
Home
Editorial Board
Editorial Policies
Current Volume
Archive
Scientific Integrity
Publication Ethics Statements
Interviews with Outstanding Authors
Newsroom
Sponsored Conferences
Podcast
Contact
Special Collections
Submit an Article
Online ISSN: 1945-4589
Research Paper
|
Volume 13, Issue 7
|
pp. 9398–9418
A novel oral nutritional supplement improves gait speed and mitochondrial functioning compared to standard care in older adults with (or at risk of) undernutrition: results from a randomized controlled trial
Back to article
Figure 3
(3 of 5)
−
100%
+
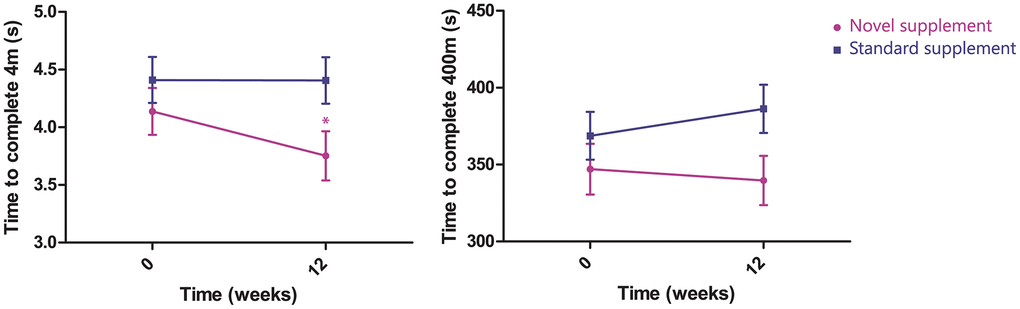
Figure 3.
Change in time to complete 4 m (left, time*treatment effect P=0.047) and 400 m (right, time*treatment effect P=0.038, n=81).