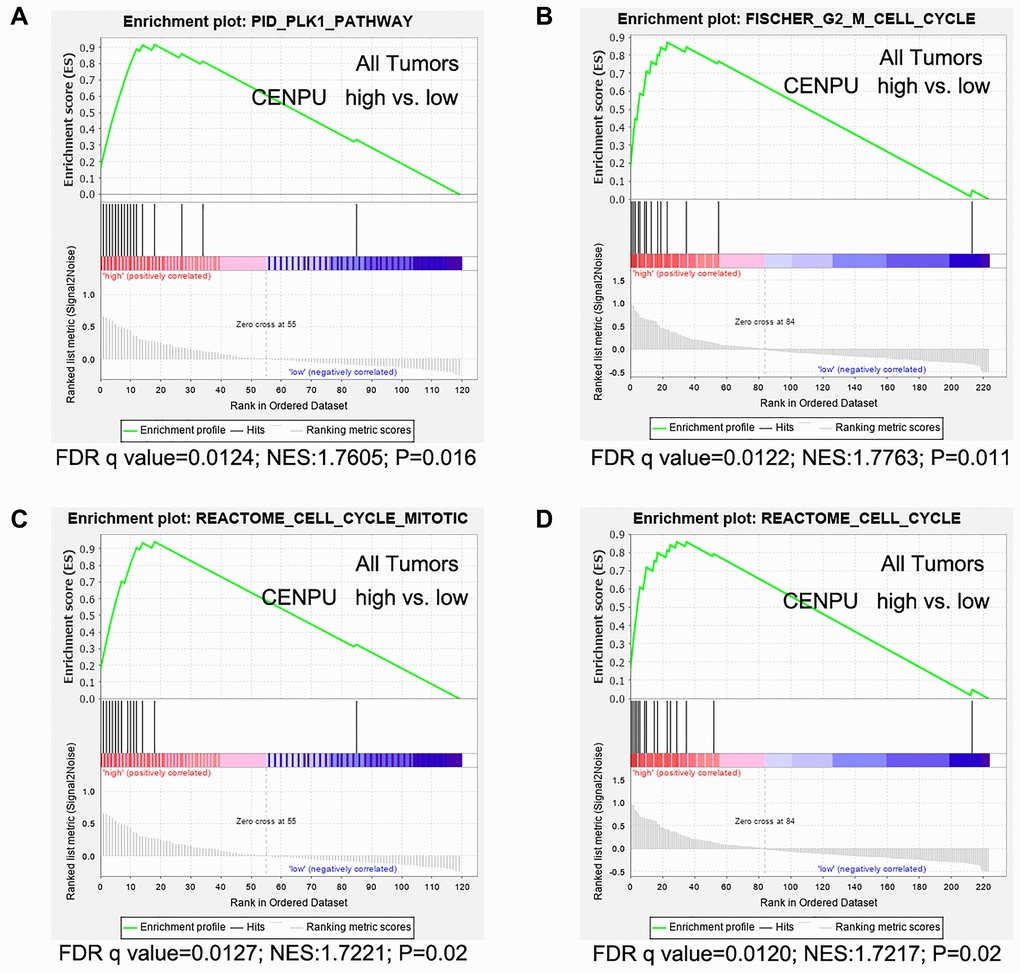
Figure 6.Gene set enrichment analyses were performed using gene expression data of 226 African-American women with triple negative breast cancer (TNBC). (A) Genes are enriched in PLK1 pathway. (B) Genes are enriched in Fisher G2-M cell cycle. (C) Genes are enriched in the Reactome cell cycle mitotic. (D) Genes are enriched in Reactome cell cycle. False discovery rate (FDR) q value, normalized enrichment score (NES), and P values are shown, vs: versus.