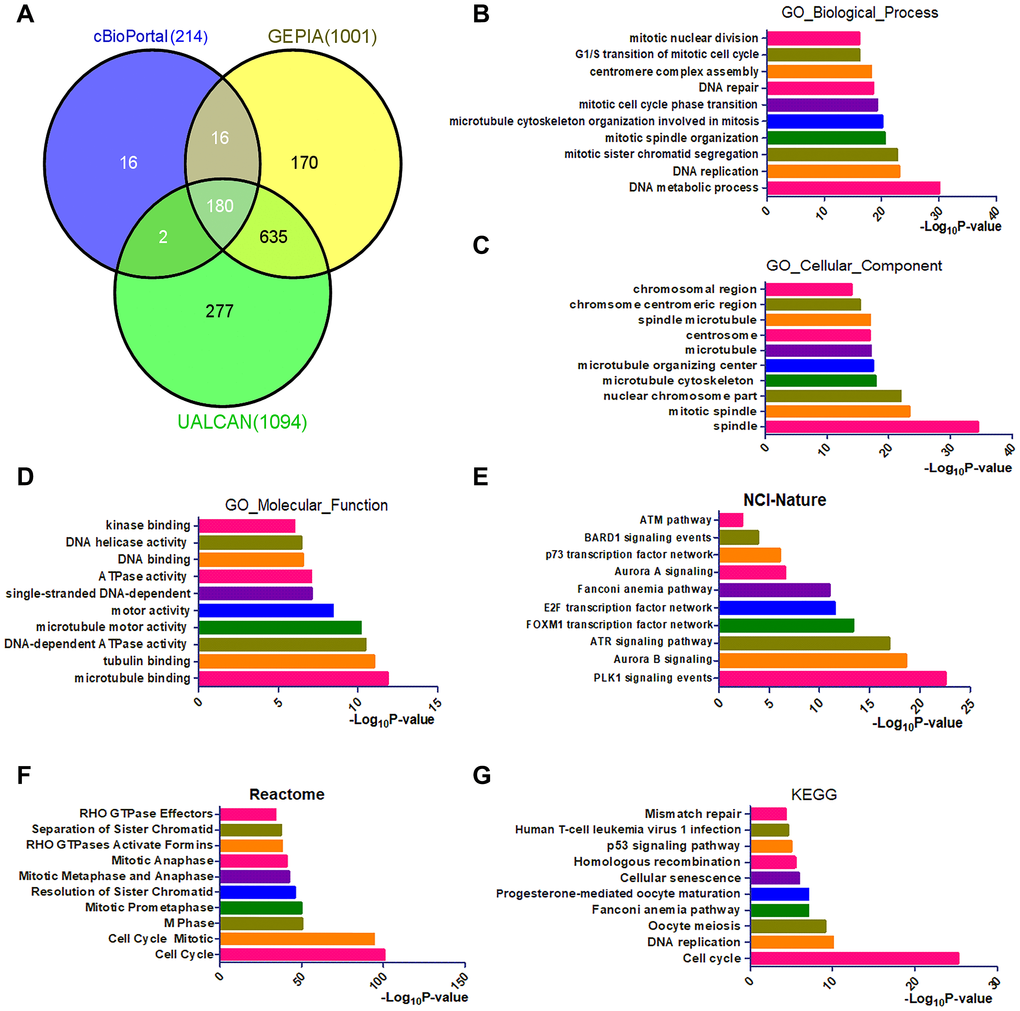
Figure 4.Identification and functional analysis of genes that exhibited co-expression with CENPU. (A) The Venn diagram of CENPU’s co-expressed genes from UALCAN, GEPIA, and cBioPortal databases. (B–D) GO functional annotation (biological process, cellular component, and molecular function) for 180 co-expressed genes of CENPU. (E–G) Pathway (NCI-Nature, Reactome, and KEGG) enrichment analysis for these 180 co-expressed genes of CENPU.