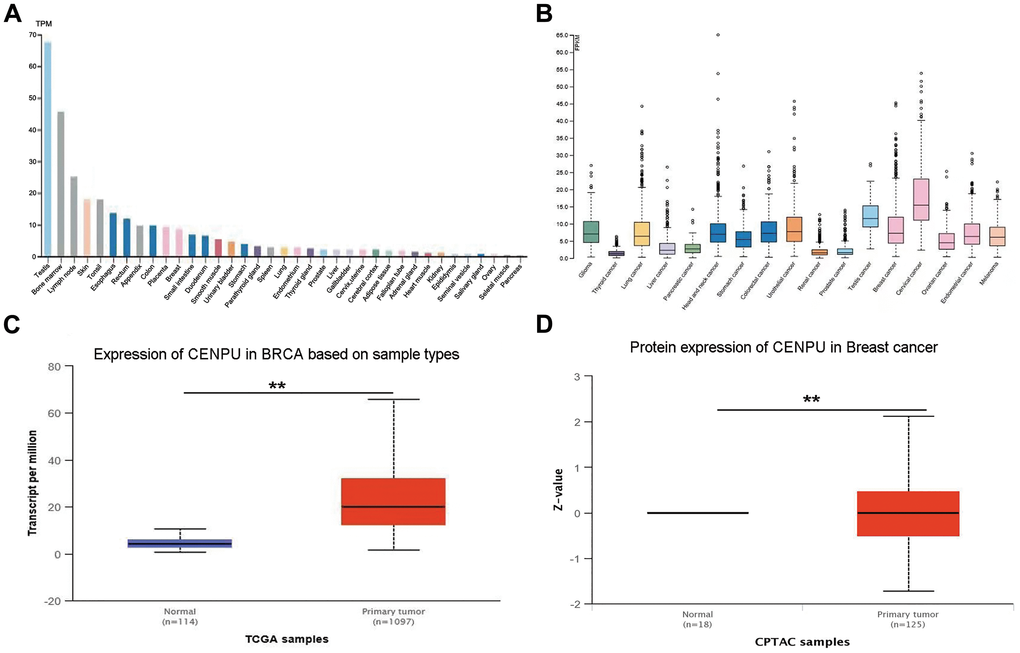
Figure 1.CENPU expression in normal and cancerous tissues. (A) CENPU mRNA expression in different normal tissues from the HPA database. (B) CENPU mRNA expression in different cancer tissues from the HPA database. (C–D) The mRNA and protein level expression of CENPU in breast cancer compared with normal tissue by analyzing UALCAN database, **P < 0.01.