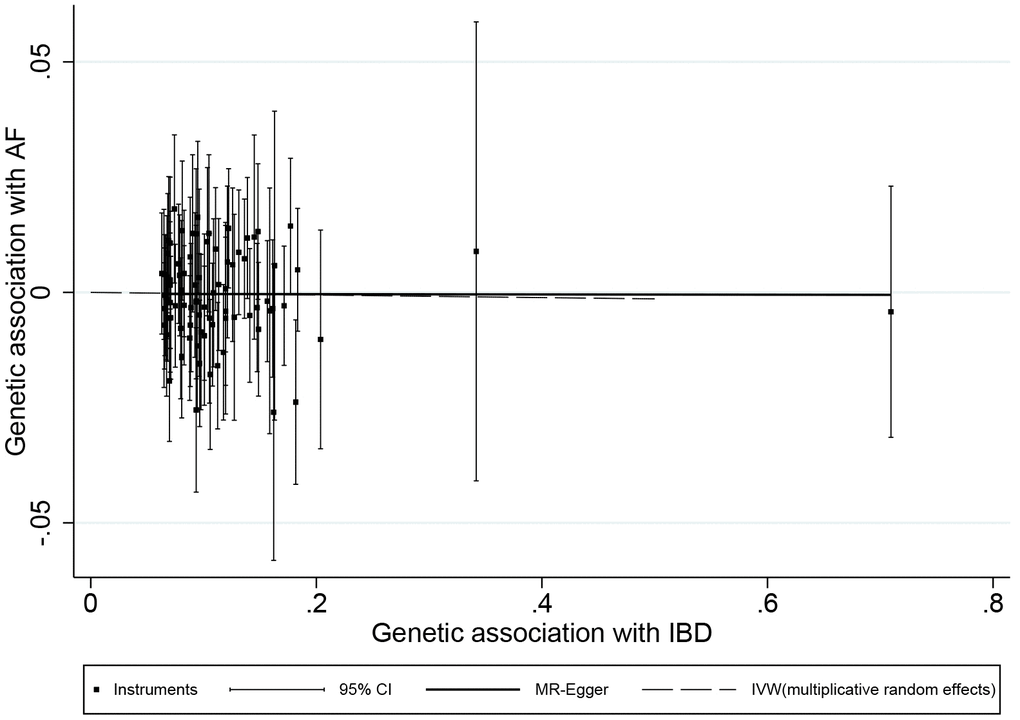
Figure 2.Scatter plot of genetic associations with atrial fibrillation against associations with inflammatory bowel disease, with causal estimates (β coefficients) of inflammatory bowel disease on atrial fibrillation estimated by inverse-variance weighted (dashed line), and MR-Egger (solid line) methods. The straight lines should be the change in the log odds of atrial fibrillation per unit increase of the log odds of inflammatory bowel disease.