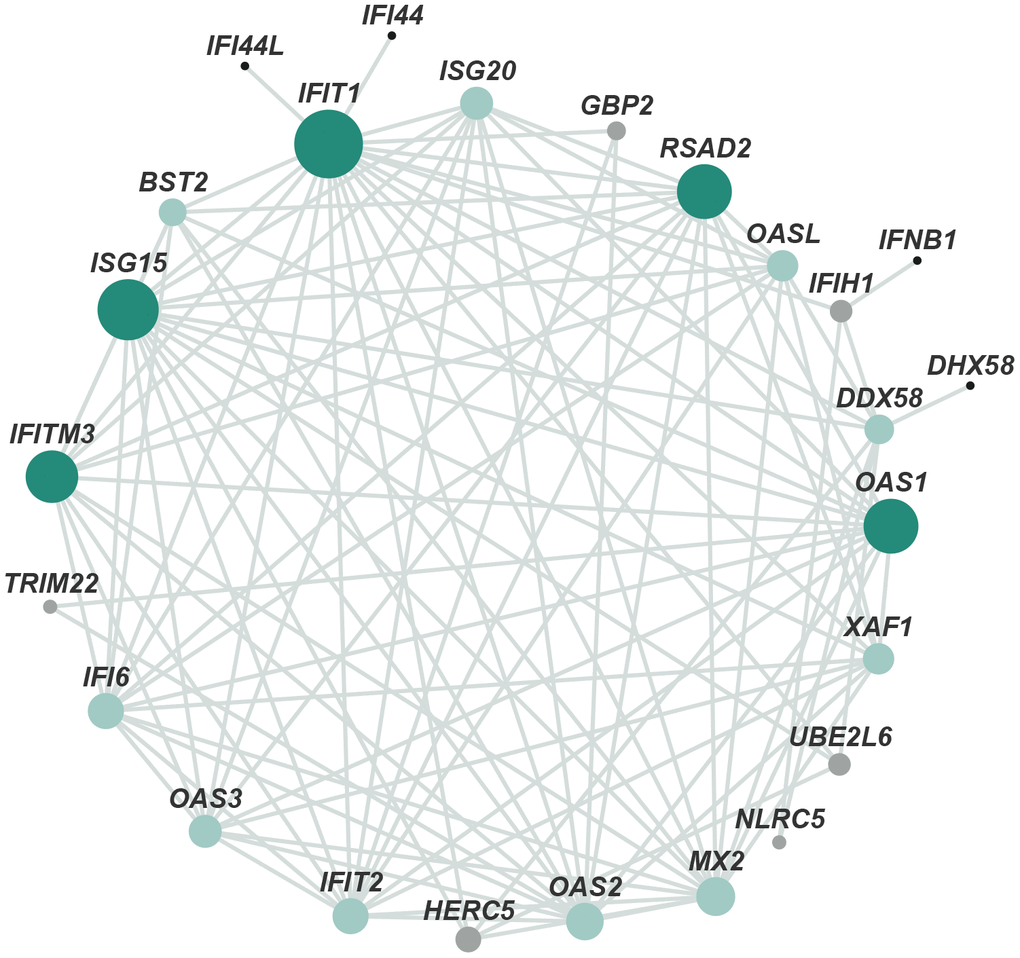
Figure 3.Protein–protein interaction network of DEGs. The main network cluster of DEGs was mapped from 205 genes and 300 relationships. Each node represents a protein and each edge represents an interaction between two proteins. Node color from black to green represents lowest to highest betweenness centrality (BC). The size of each node corresponds to the degree (number of connections).