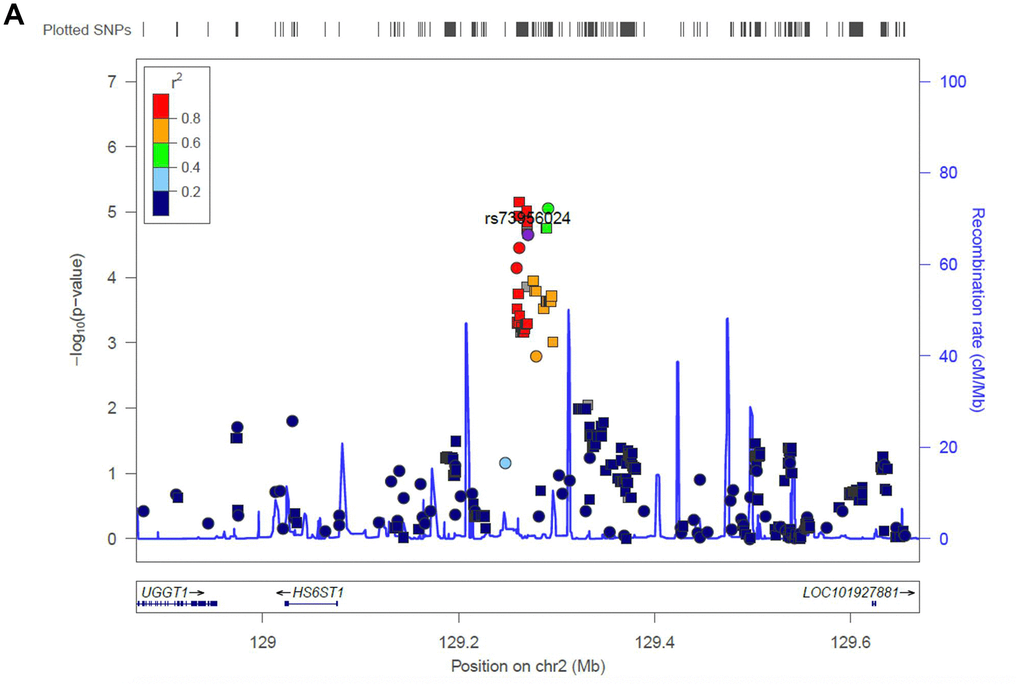
Figure 3a.Regional association plot of the novel loci. Association of SNPs at 15q25.3 with ALL susceptibility in adult (A) and childhood (B). (C) Association of SNPs at 2q14.3 with ALL susceptibility in all-age patients. Genotyped and imputed SNPs were labeled in circles and squares, respectively.