Submit an Article
Navigate
Home
Editorial Board
Editorial Policies
Current Volume
Archive
Scientific Integrity
Publication Ethics Statements
Interviews with Outstanding Authors
Newsroom
Sponsored Conferences
Podcast
Contact
Special Collections
Submit an Article
Online ISSN: 1945-4589
Research Paper
|
Volume 13, Issue 8
|
pp. 11988–12006
High expression of COMMD7 is an adverse prognostic factor in acute myeloid leukemia
Back to article
Figure 4
(4 of 10)
−
100%
+
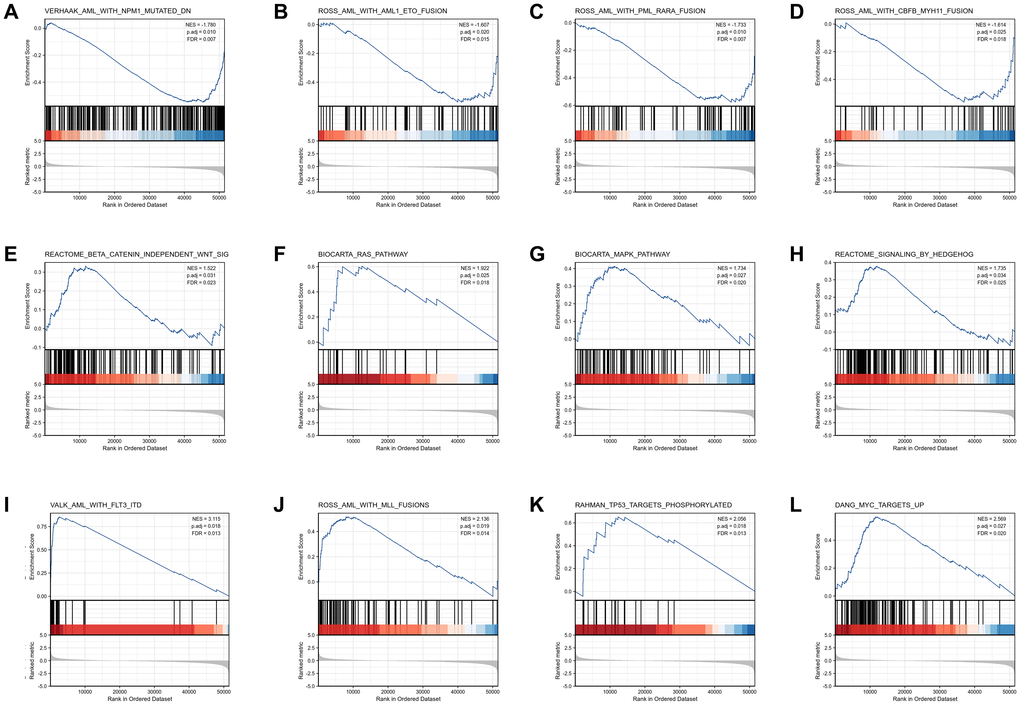
Figure 4.
Enrichment plots from the gene set enrichment analysis (GSEA).
(
A
–
L
) ES, enrichment score; NES, normalized ES; ADJ
P
-val, adjusted
P
-value.
Figure 4 — High expression of COMMD7 is an adverse prognostic factor in acute myeloid leukemia | Aging