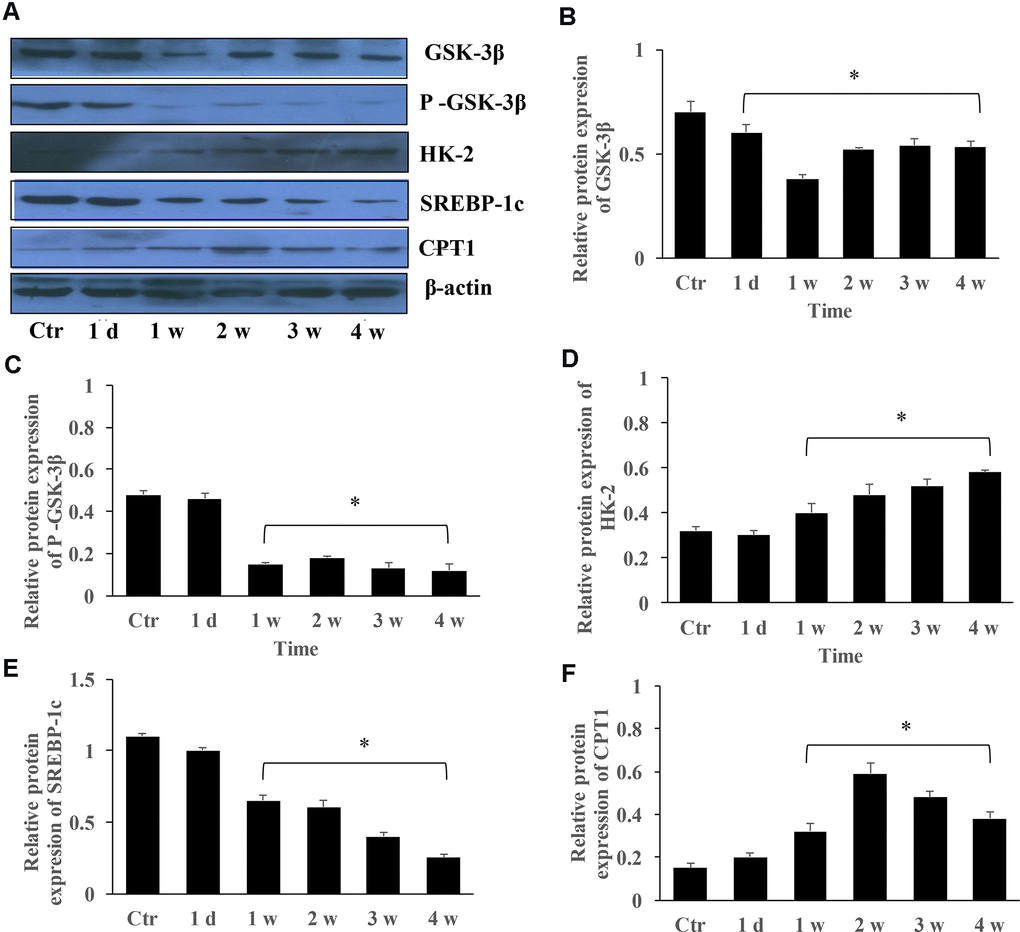
Figure 5.The protein expression changes of GSK-3β, HK-2, SREBP-1c, and CPT-1 in the group PAH. (A) The protein levels in the lung tissues of PAH rats was measured using western blotting; (B) The protein expression change of GSK-3β was quantified; (C) The protein expression of p-GSK-3β was quantified; (D) The protein expression of HK-2 in the lung tissues was quantified; (E) The protein expression of SREBP-1c was quantified; (F) The protein expression of CPT-1 was quantified. (*P<0.05, compared with control group).