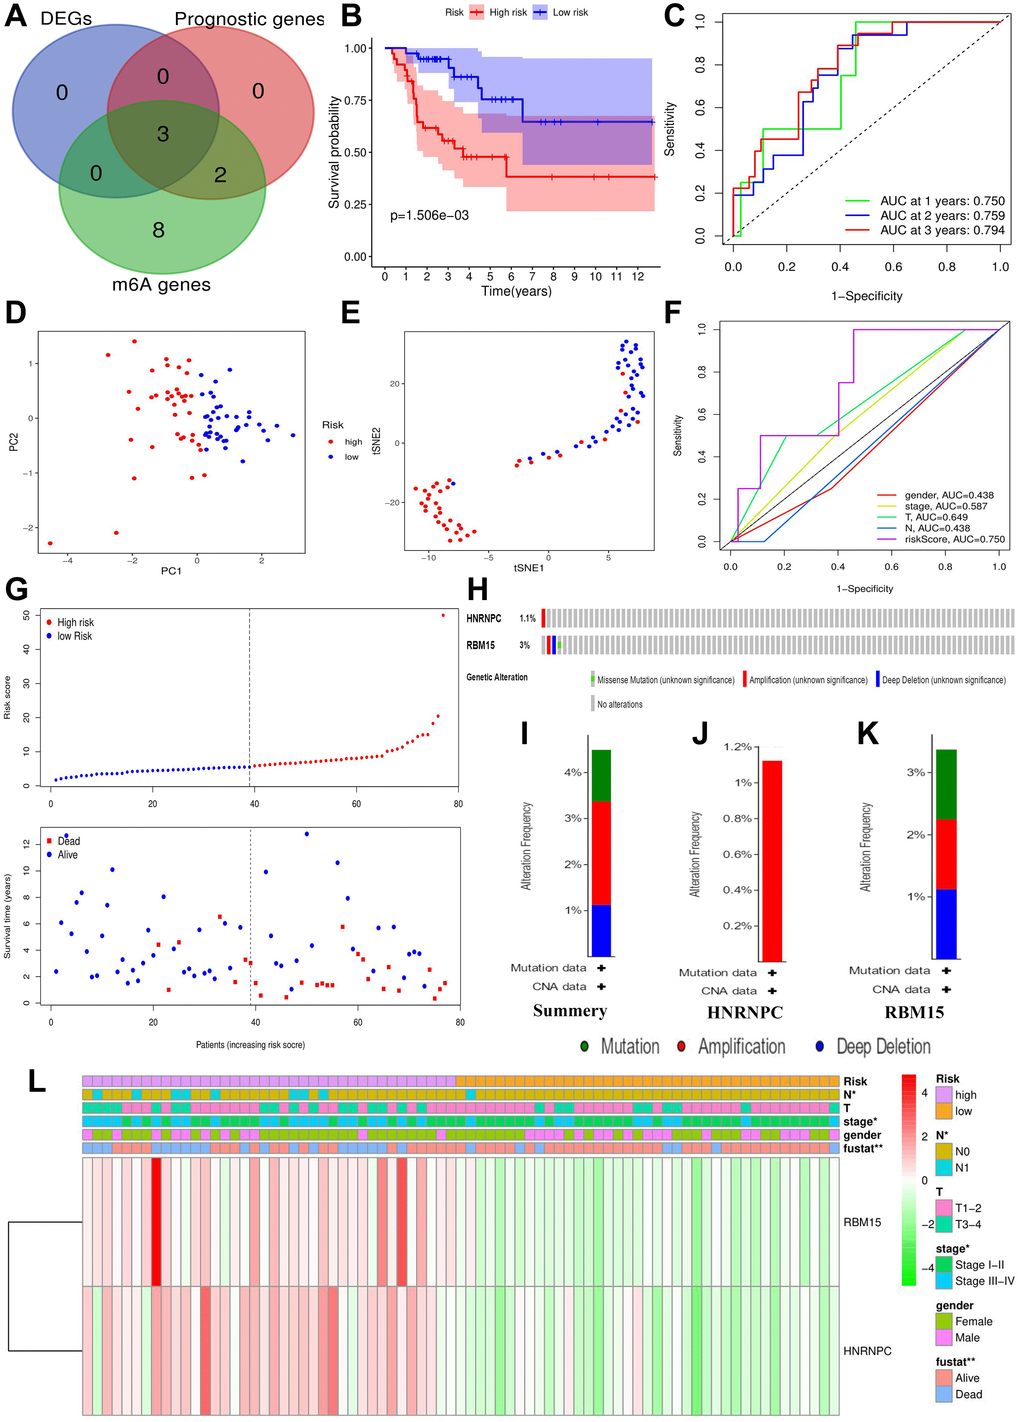
Figure 4.Construction of m6A-related risk signature. (A) Identification of m6A-related prognostic DEGs. (B) The survival difference between the high- (n = 39) and low-risk groups (n = 38). (C) Time-dependent ROC curves of m6A risk signature. (D) PCA plot of m6A risk signature. (E) t-SNE plot of m6A risk signature. (F) ROC curves of m6A risk signature and ACC clinical parameters. (G) Risk plots of m6A risk signature. (H) The summary of HNRNPC and RBM15 mutations. (I) The summary of mutation types. (J) The mutation types of HNRNPC. (K) The mutation types of RBM15. (L) The heatmap of m6A risk signature. The relationships between m6A-related risk levels and the clinicopathological characteristics of ACC were determined by Kolmogorov–Smirnov test. Overexpression is presented in red and low expression is green. DEGs, differentially expressed genes; ROC, receiver operating characteristic curve; PCA, principal component analysis; s-SNE, t-distributed stochastic neighbor embedding; *P < 0.05, **P < 0.01.