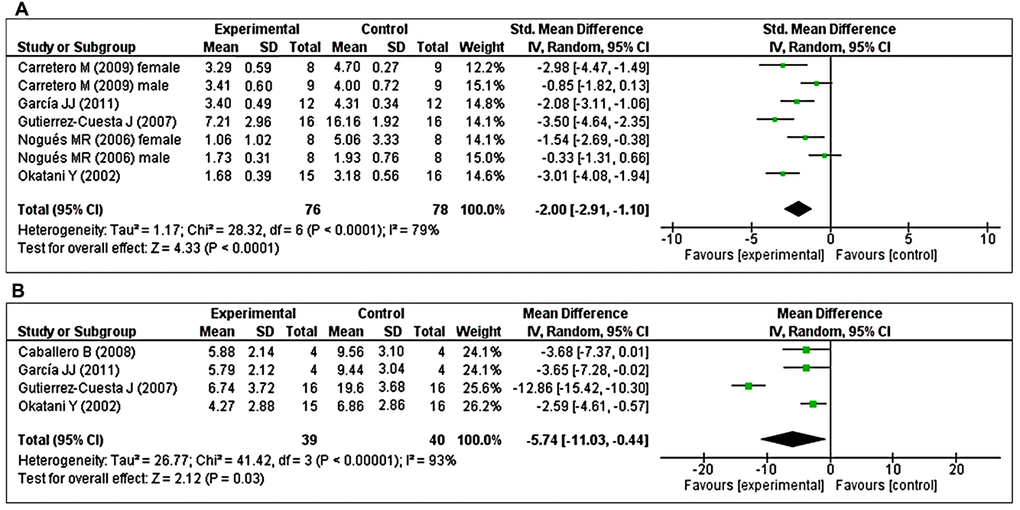
Figure 4.Forest plot comparing changes in the abundance of LPO and carbonylated protein levels between MT-treated and vehicle-treated groups. Compared with vehicle treatment, (A) LPO and (B) carbonylated protein levels were both significantly reduced in the MT-treated group. The unit for LPO almost in all studies is nmol/mg, except Nogues MR et al. (nmol/ml). For carbonylated protein the unit is nmol/mg. The prism represents the overall statistical results of the experimental data, squares represent the weight of each study, and horizontal lines represent the 95% CIs for each study. MT, melatonin; LPO, lipid peroxidation; CI, confidence interval; SD, standard deviation; IV, independent variable.