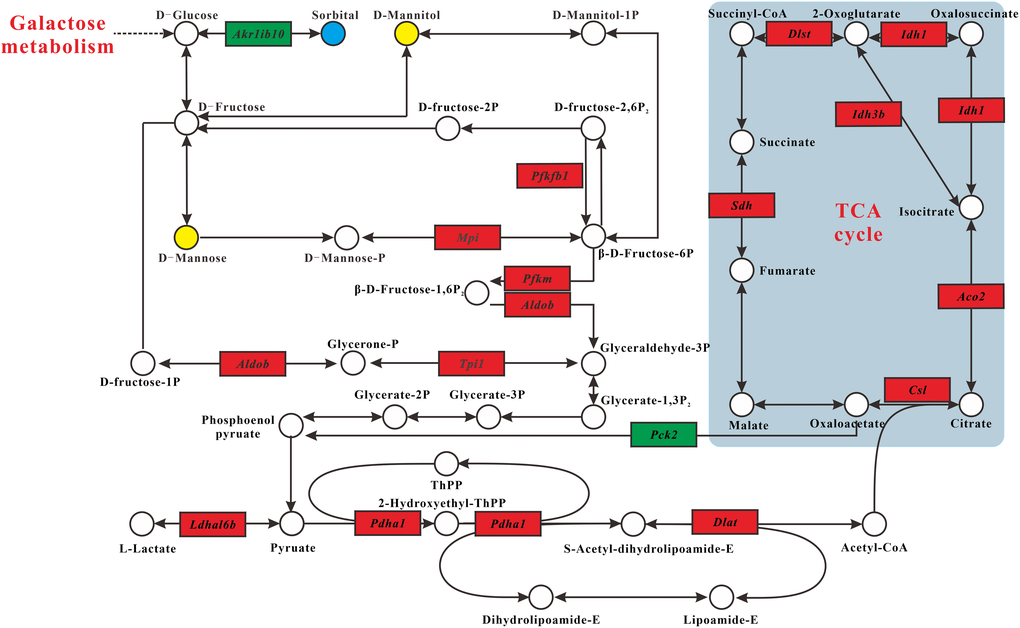
Figure 3.Carbohydrate metabolism alterations. Upregulated and downregulated genes in MT group compared with DM group are depicted as red box and green box espectively. Metabolites up- and downregulated are shown by yellow and blue circles, respectively.