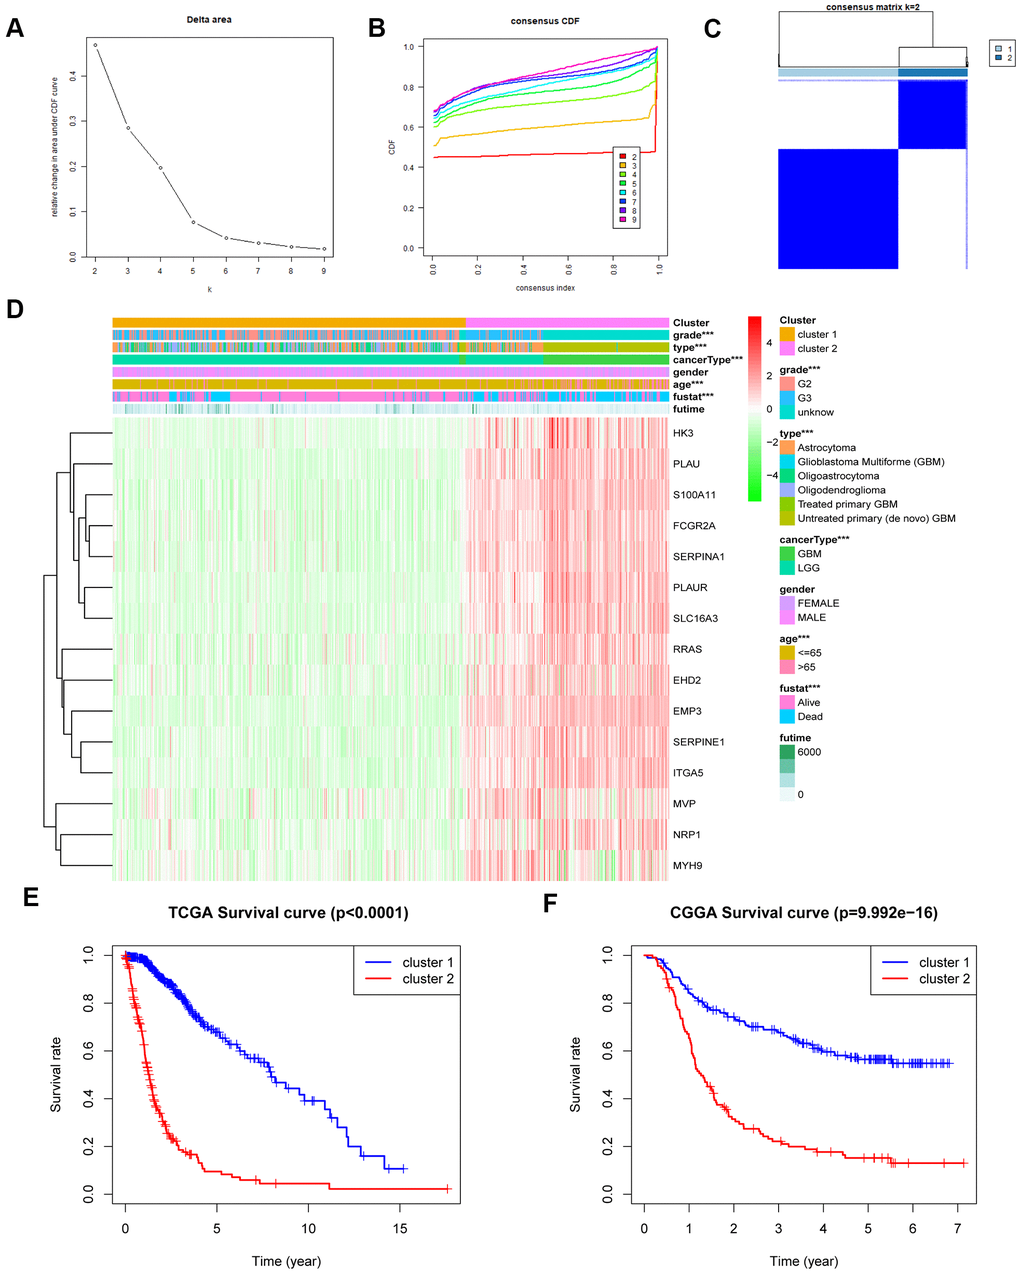
Figure 2.MES-related gene sets could classify the clinical and molecular features of gliomas. (A) Relative change in the area under the CDF curve for k = 2 to k = 9. (B) Consensus clustering CDF for k = 2 to k = 9. (C) Consensus clustering matrix of 650 samples from the TCGA dataset for k = 2. (D) Heat map of MES-related genes between cluster 1 and cluster 2 of the TCGA cohort. (E) Survival analysis of patients in cluster 1 and cluster 2 based on TCGA clinical data. (F) Survival analysis of patients in cluster 1 and cluster 2 based on CGGA clinical data. CDF, cumulative distribution function; ***P <0.001.