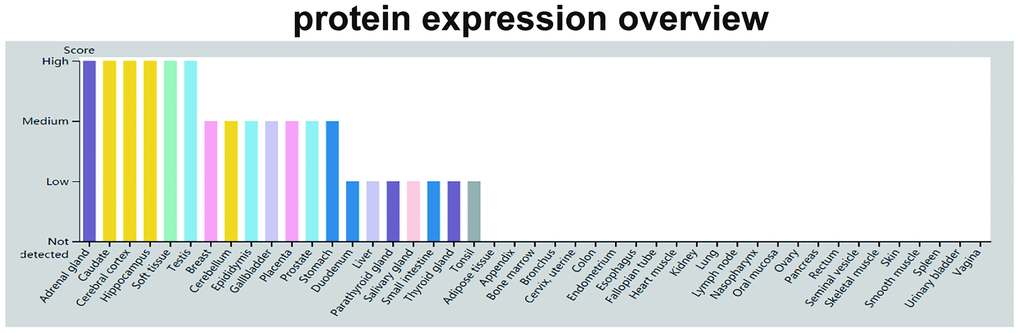
Figure 4.GDF11 protein expression data. The color-coding is based on tissues with common functional features. The mouse-over function shows protein score for analyzed cell types found in a selected tissue (http://www.proteinatlas.org/ENSG00000135414-GDF11/tissue).