Submit an Article
Navigate
Home
Editorial Board
Editorial Policies
Current Volume
Archive
Scientific Integrity
Publication Ethics Statements
Interviews with Outstanding Authors
Newsroom
Sponsored Conferences
Podcast
Contact
Special Collections
Submit an Article
Online ISSN: 1945-4589
Research Paper
|
Volume 13, Issue 7
|
pp. 10724–10748
A novel focal adhesion related gene signature for prognostic prediction in hepatocellular carcinoma
Back to article
Figure 8
(8 of 9)
−
100%
+
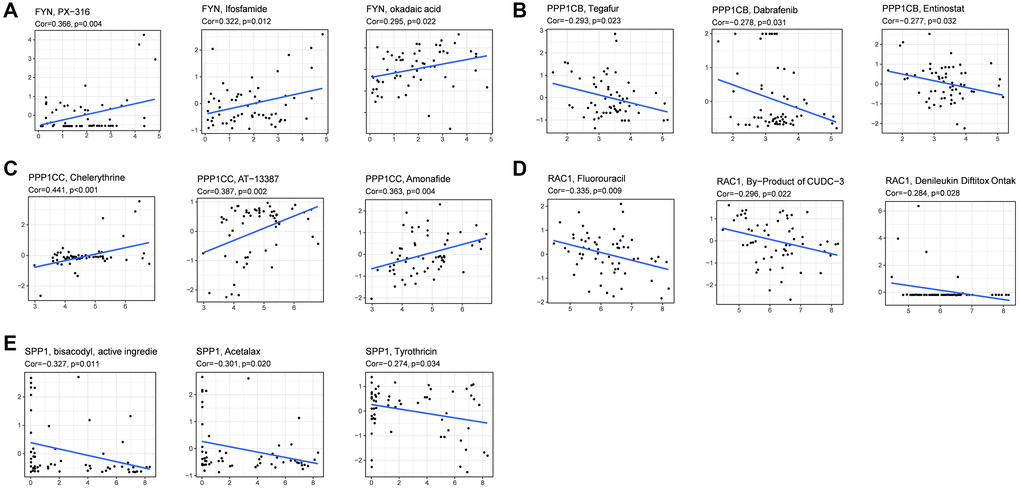
Figure 8.
Scatter plots of the association between prognostic gene expression and drug sensitivity.
(
A
) FYN. (
B
) PPP1CB. (
C
) PPP1CC. (
D
) RAC1. (
E
) SPP1.