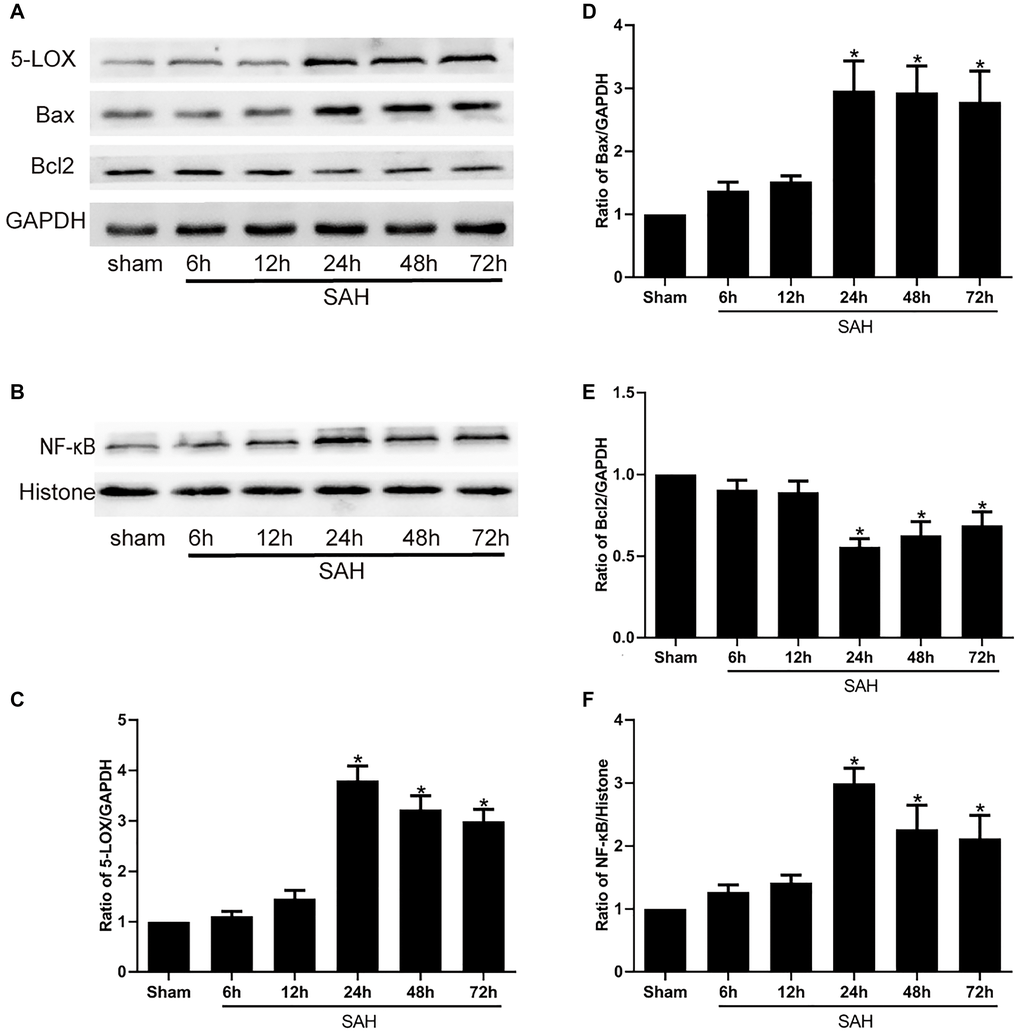
Figure 1.Levels of 5-LOX and NF-κB, Bax and Bcl2 protein at the indicated times after SAH. (A, B) Representative Western blots showing expression levels of 5-LOX, NF-κB, Bcl-2 and Bax. (C–F) Densitometric quantification of the protein bands. N = 6 in each group; *P < 0.05 vs sham group.