Submit an Article
Navigate
Home
Editorial Board
Editorial Policies
Current Volume
Archive
Scientific Integrity
Publication Ethics Statements
Interviews with Outstanding Authors
Newsroom
Sponsored Conferences
Podcast
Contact
Special Collections
Submit an Article
Online ISSN: 1945-4589
Research Paper
|
Volume 13, Issue 7
|
pp. 9253–9264
Beneficial effect of Arbidol in the management of COVID-19 infection
Back to article
Figure 2
(2 of 3)
−
100%
+
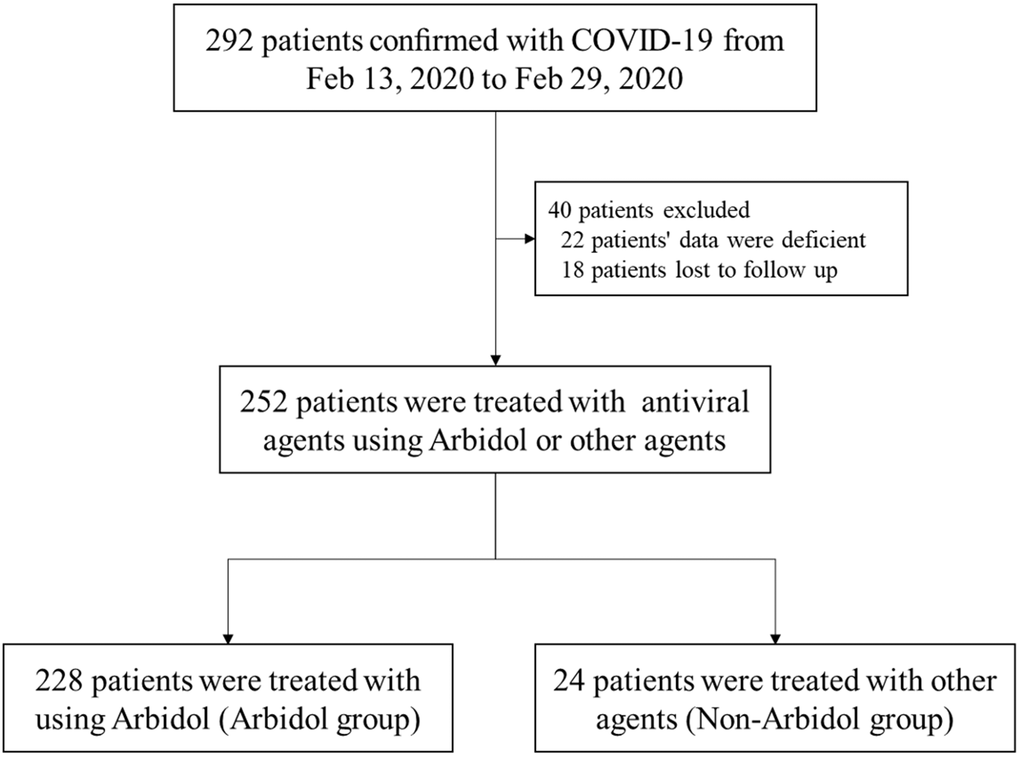
Figure 2.
Flowchart of patient cohort.
Inclusion or exclusion of patients according to their antiviral medications and subsequent follow-up records.