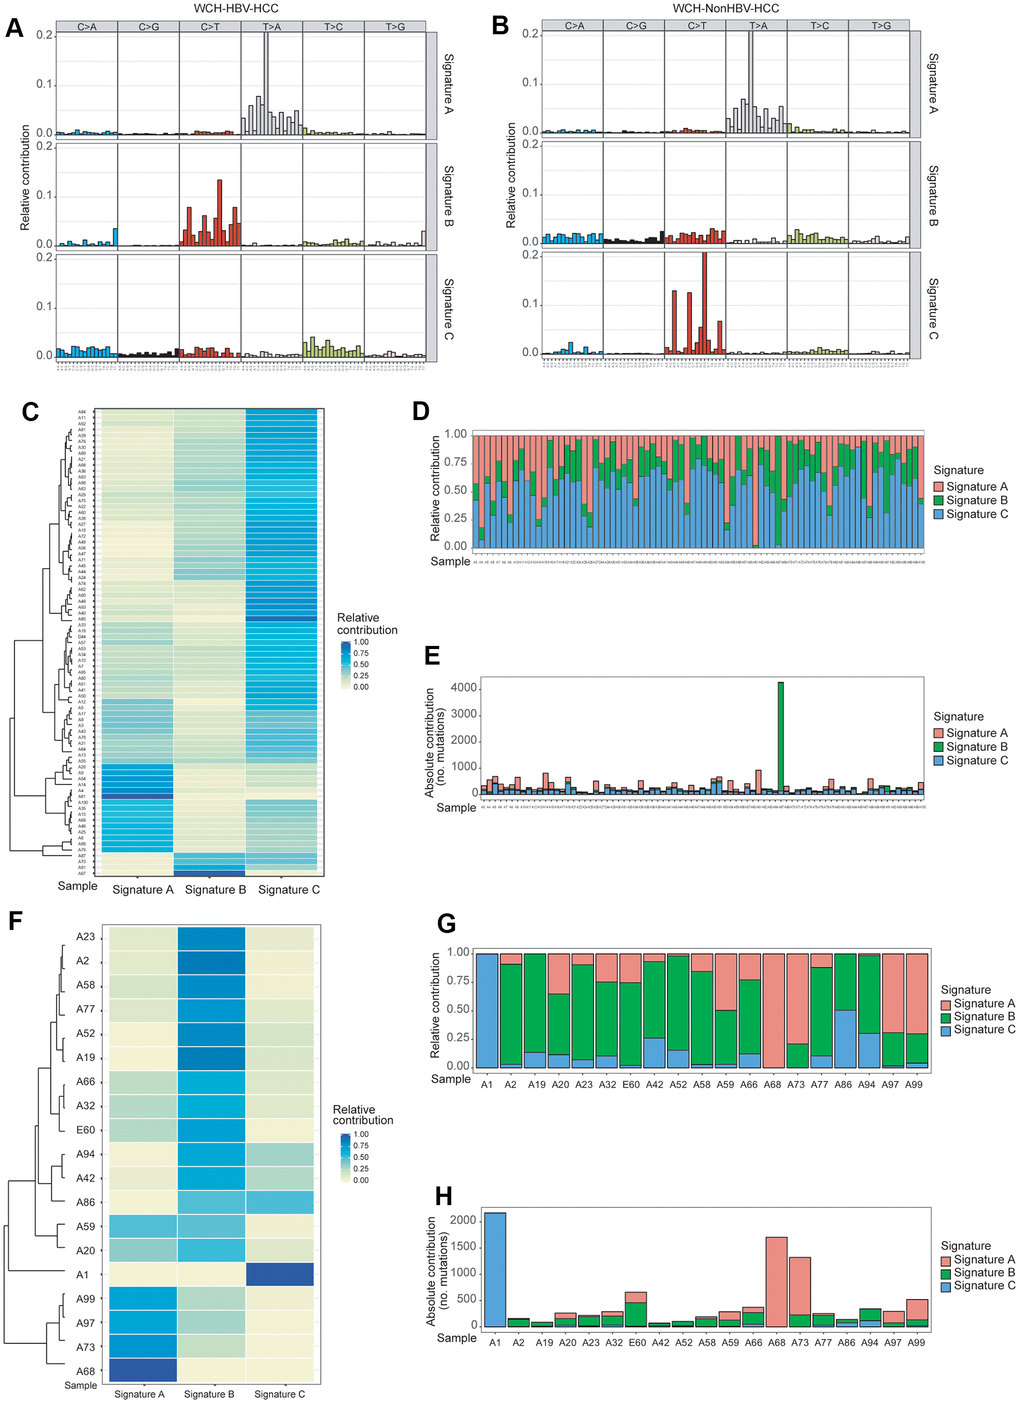
Figure 2.Identification of mutation Signatures in the WCH group. (A) Patterns of 3 signatures (Signatures A–C) identified in the WCH-HBV-HCC group. (B) Patterns of 3 signatures (Signatures A–C) identified in the WCH-NonHBV-HCC group. (C) The distribution of mutation Signatures that were identified in the WCH-HBV-HCC group. (D) The relative contribution of the 3 Signatures in samples from the WCH-HBV-HCC group. (E) The contributions of mutational signatures to tumors in the WCH-HBV-HCC group. The sample names are displayed on the horizontal axis, whereas the vertical axis depicts the number of mutations of samples in the WCH-HBV-HCC group. (F) The distribution of mutation Signatures that were identified in the WCH-NonHBV-HCC group. (G) The relative contribution of the 3 Signatures in samples from the WCH-NonHBV-HCC group. (H) The contributions of mutational signatures to tumors in the WCH-NonHBV-HCC group.