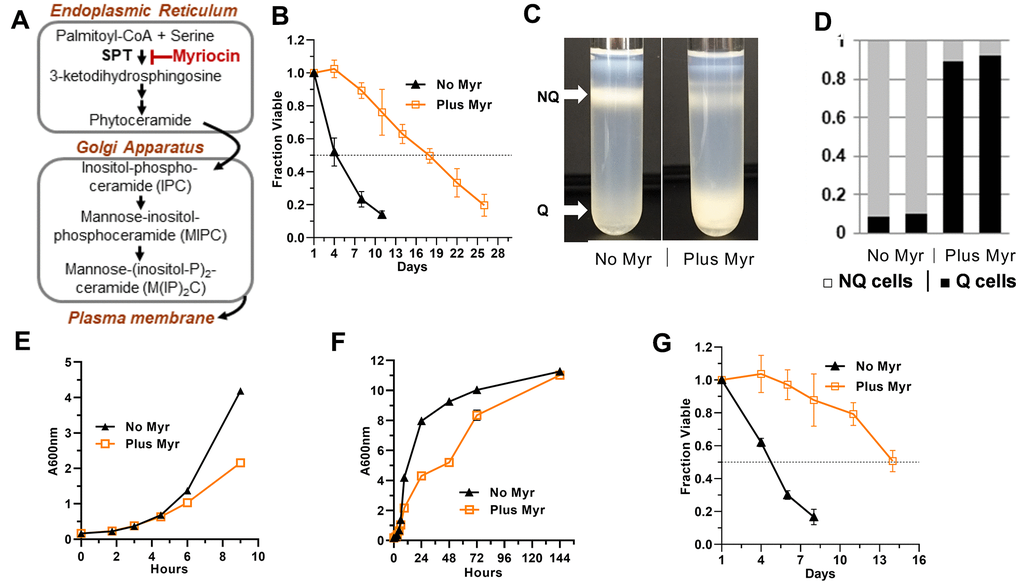
Figure 1.Effects of Myr on quiescence and lifespan. (A) Outline of the sphingolipid biosynthesis pathway in yeasts. (B) Myr treatment increases lifespan of BY4741 cells grown in 25 ml cultures. Statistical significance between drug-treated and untreated cells was determined by the Area Under Curve (AUC, 95% CI: 3.515-5.178 vs 14.77-18.05). Error bars: SEM. All data shown in this Figure were done with prototrophic BY4741 cells grown in SDC medium. (C) Representative density gradients showing the difference in the distribution of quiescent (Q) and non-quiescent (NQ) cells on day 3 of a lifespan assay in cultures without and with Myr treatment. (D) The number of cells in the Q and NQ bands from a density gradient were counted and plotted as a fraction of total cells. Data for two gradients with each condition (untreated and Myr-treated cells) are shown. (E) Myr treatment begins to slow growth around 4 h after cells are inoculated into 200 mls of medium. (F) Myr treatment slows growth initially, but by 144 h the cell density of treated and untreated cells is similar. (G) Lifespan assay of cells grown in 200 ml cultures (AUC, 95% CI: 3.561-4.072 vs 9.962-12.78).