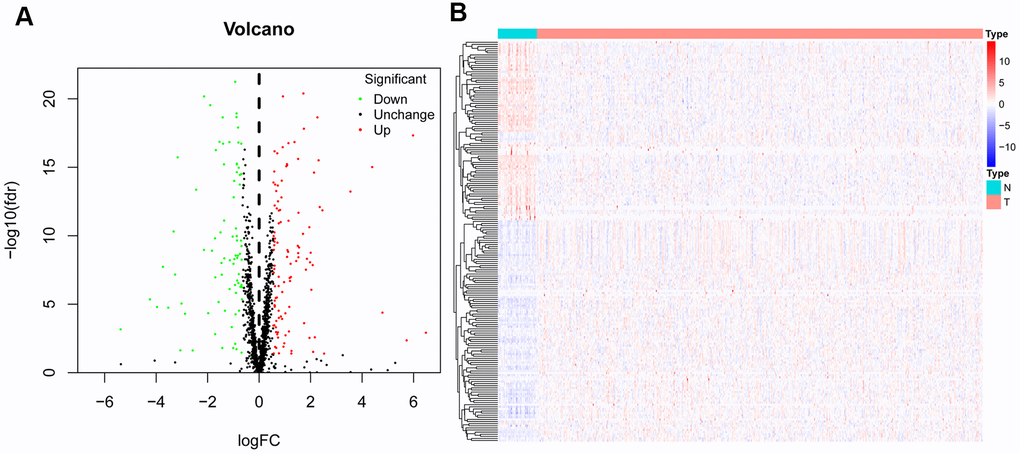
Figure 2.Differentially expressed RBPs in HNSCC and non-tumour samples. The volcano plot (A) and Clustered heatmap (B) of differentially expressed RBPs in HNSCC and normal tissues.
Figure 2 — Development and validation of a RNA binding protein-associated prognostic model for head and neck squamous cell carcinoma | Aging