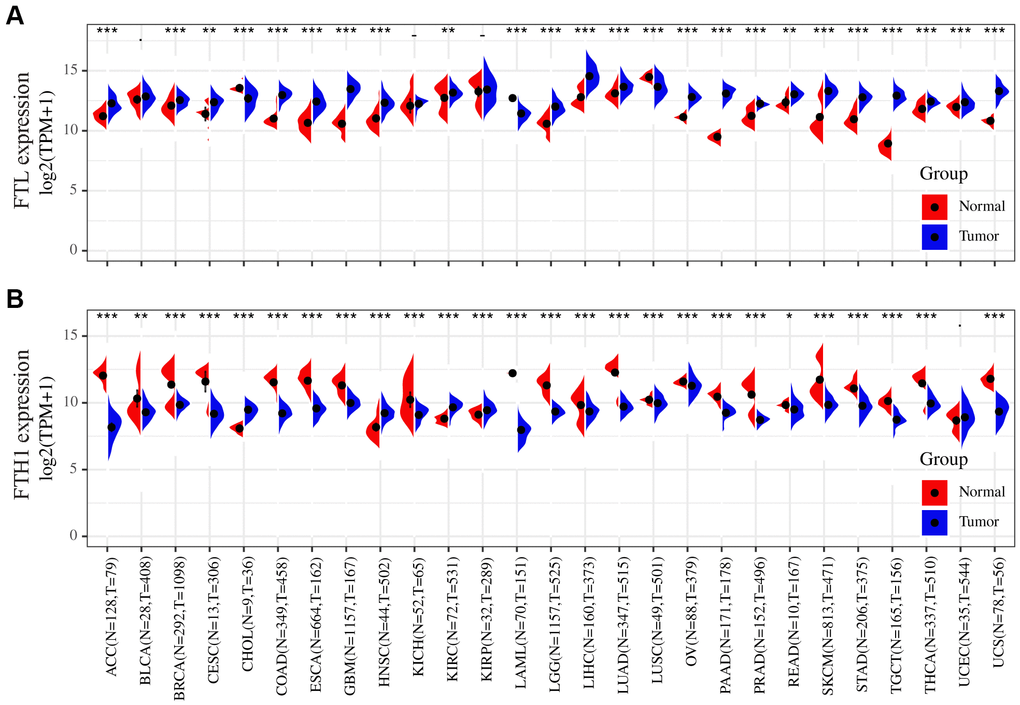
Figure 1.Differences in the FTL and FTH1 expressions between 27 tumors and corresponding normal tissues. (A) FTL level was up-regulated in tumors of ACC, BRCA, CESC, COAD, ESCA, GBM, HNSC, KIRC, LGG, LIHC, LUAD, OV, PAAD, PRAD, READ, SKCM, STAD, TGCT, THCA, UCEC, UCS, down-regulated of CHOL, LAML, LUSC. (B) FTH1 level was up-regulated in tumors of CHOL, HNSC, KIRC, KIRP, down-regulated of ACC, BRCA, BLCA, CESC, COAD, ESCA, GBM, KICH, LAML, LUSC, LGG, LIHC, LUAD, OV, PAAD, PRAD, READ, SKCM, STAD, TGCT, THCA, UCS. Datasets were from TCGA and GTEx. - not significant, * P < 0.05, ** P <0.01, *** P < 0.001.