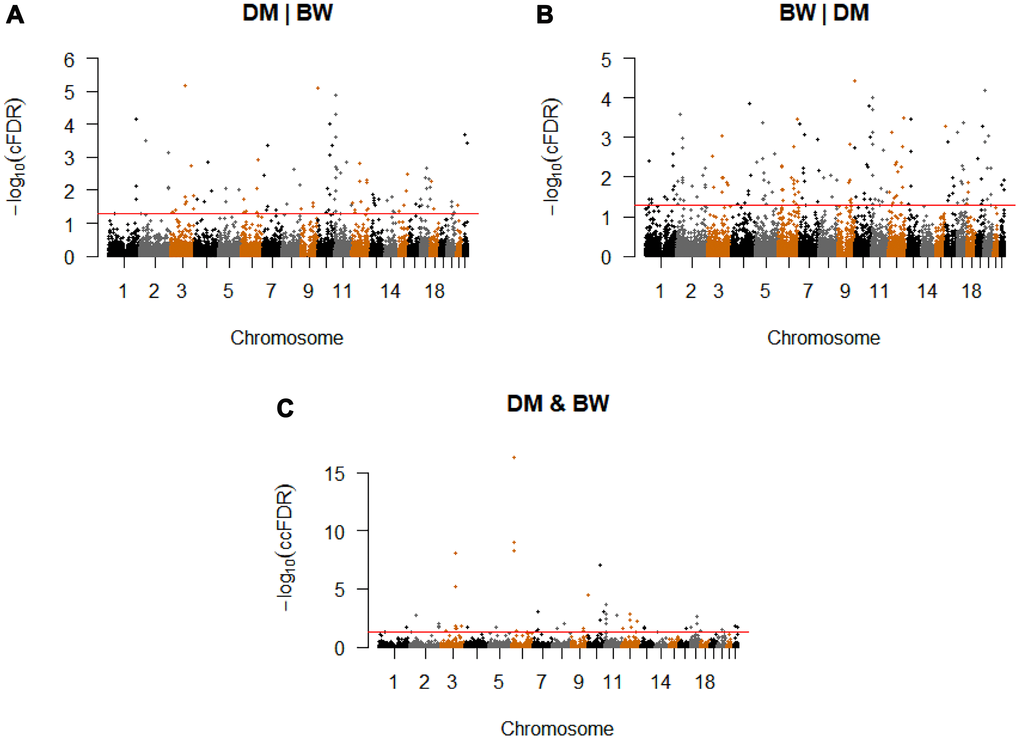
Figure 2.Conditional Manhattan plot. Conditional Manhattan plot of conditional -log10(FDR) values for (A) T2D given BW (T2D|BW), (B) BW given T2D (BW|T2D), (C) T2D and BW. The red line marks the conditional -log10(FDR) values of 1.3 corresponds to a cFDR ≤ 0.05.