Submit an Article
Navigate
Home
Editorial Board
Editorial Policies
Current Volume
Archive
Scientific Integrity
Publication Ethics Statements
Interviews with Outstanding Authors
Newsroom
Sponsored Conferences
Podcast
Contact
Special Collections
Submit an Article
Online ISSN: 1945-4589
Research Paper
|
Volume 13, Issue 7
|
pp. 10603–10618
Tumor suppressor DCAF15 inhibits epithelial-mesenchymal transition by targeting ZEB1 for proteasomal degradation in hepatocellular carcinoma
Back to article
Figure 1
(1 of 8)
−
100%
+
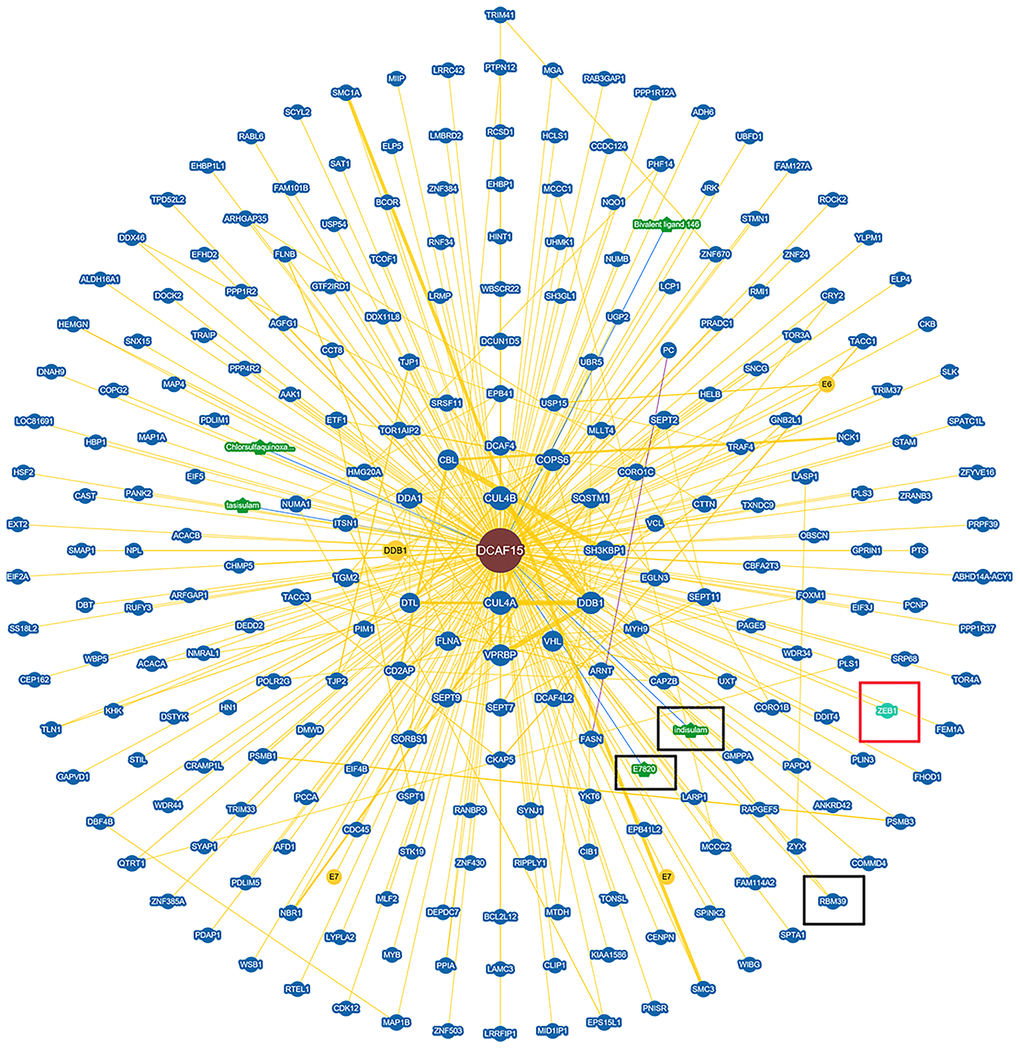
Figure 1.
Protein network diagram shows potential interaction of DCAF15.
Black frame indicates the interactors of DCAF15 reported. Red frame indicates ZEB1 is a potential interactor of DCAF15.