Submit an Article
Navigate
Home
Editorial Board
Editorial Policies
Current Volume
Archive
Scientific Integrity
Publication Ethics Statements
Interviews with Outstanding Authors
Newsroom
Sponsored Conferences
Podcast
Contact
Special Collections
Submit an Article
Online ISSN: 1945-4589
Research Paper
|
Volume 13, Issue 7
|
pp. 10535–10554
Expression profiles and potential functions of long noncoding RNAs and mRNAs in autoimmune pulmonary alveolar proteinosis patients
Back to article
Figure 7
(7 of 8)
−
100%
+
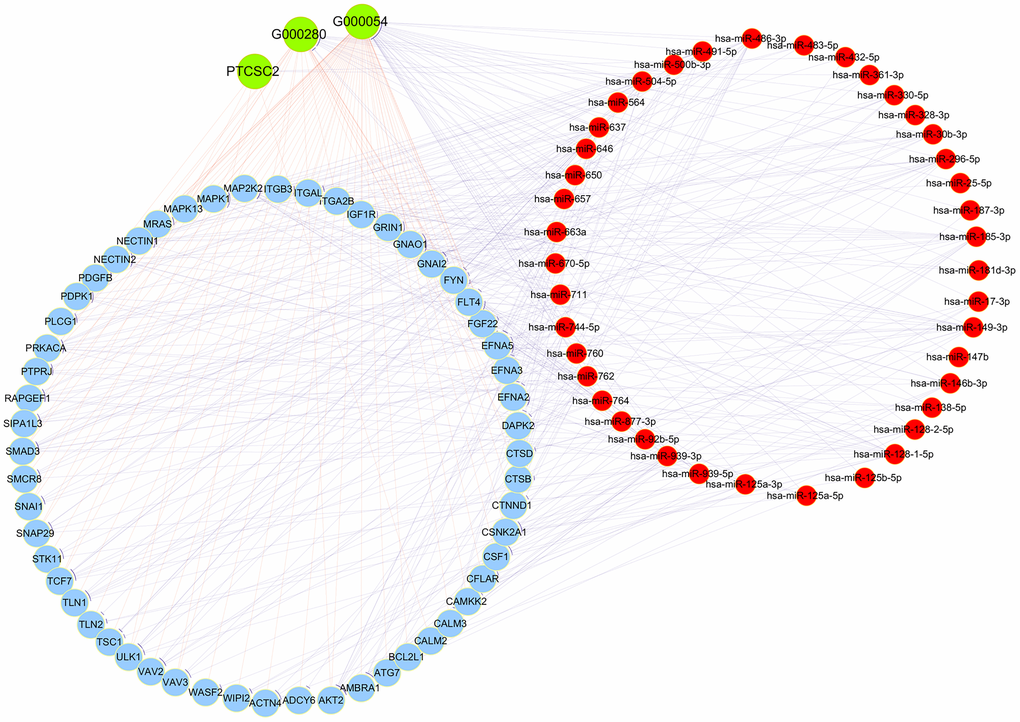
Figure 7.
CeRNA network analysis.
Red circles represent miRNAs, blue circles represent mRNAs and green circles represent lncRNAs.