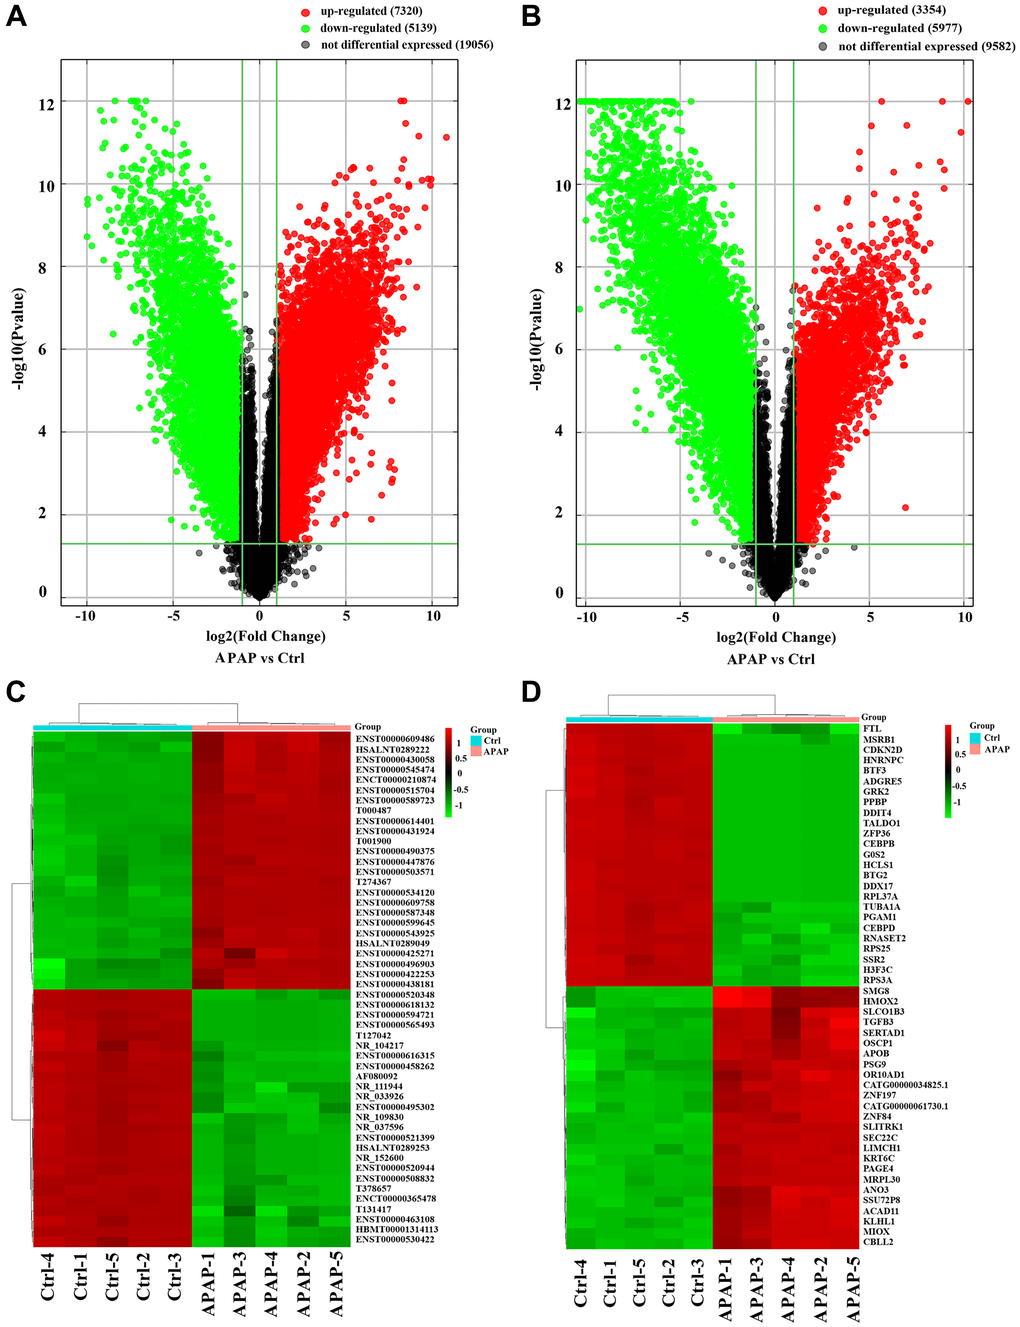
Figure 1.Identification of DE lncRNAs and mRNAs in APAP patients. (A, B) Volcano plots presenting differences in the expression of lncRNAs and mRNAs between the APAP and control groups. Values plotted on the x- and y-axes represent the averaged normalized signal values of each group (log2-scaled). Red indicates upregulation, green indicates downregulation and black indicates no difference. (C, D) Heatmaps showing the expression profiles of the top DE lncRNAs and mRNAs.