Submit an Article
Navigate
Home
Editorial Board
Editorial Policies
Current Volume
Archive
Scientific Integrity
Publication Ethics Statements
Interviews with Outstanding Authors
Newsroom
Sponsored Conferences
Podcast
Contact
Special Collections
Submit an Article
Online ISSN: 1945-4589
Research Paper
|
Volume 13, Issue 7
|
pp. 10468–10489
Global, regional, and national burdens of leukemia from 1990 to 2017: a systematic analysis of the global burden of disease 2017 study
Back to article
Figure 6
(6 of 6)
−
100%
+
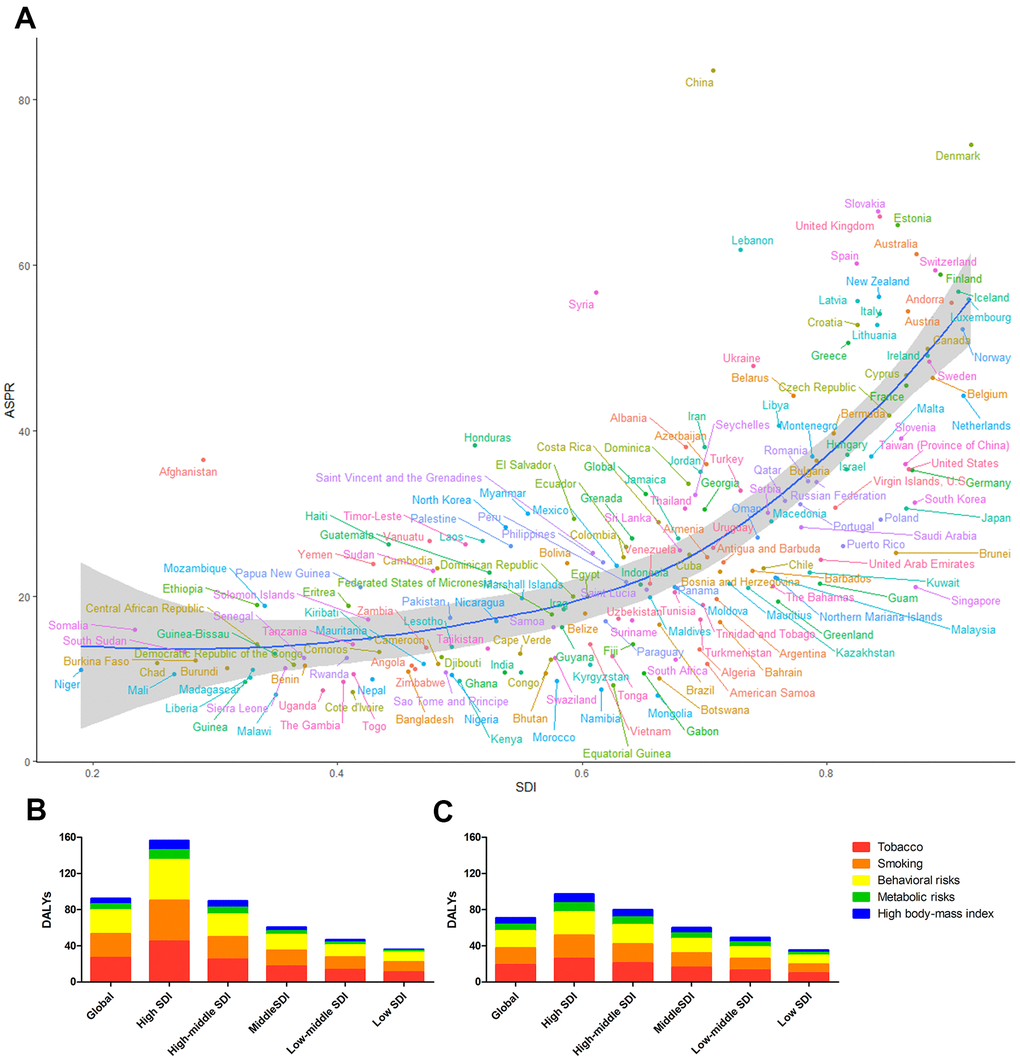
Figure 6.
(
A
) The blue line represents the expected ASPRs and SDIs in 195 countries and territories. Each point shows the observed ASPR for a specified country in 2017. The leukemia DALYs attributable to risk factors in (
B
) 1990 and (
C
) 2017.