Submit an Article
Navigate
Home
Editorial Board
Editorial Policies
Current Volume
Archive
Scientific Integrity
Publication Ethics Statements
Interviews with Outstanding Authors
Newsroom
Sponsored Conferences
Podcast
Contact
Special Collections
Submit an Article
Online ISSN: 1945-4589
Research Paper
|
Volume 13, Issue 7
|
pp. 10468–10489
Global, regional, and national burdens of leukemia from 1990 to 2017: a systematic analysis of the global burden of disease 2017 study
Back to article
Figure 3
(3 of 6)
−
100%
+
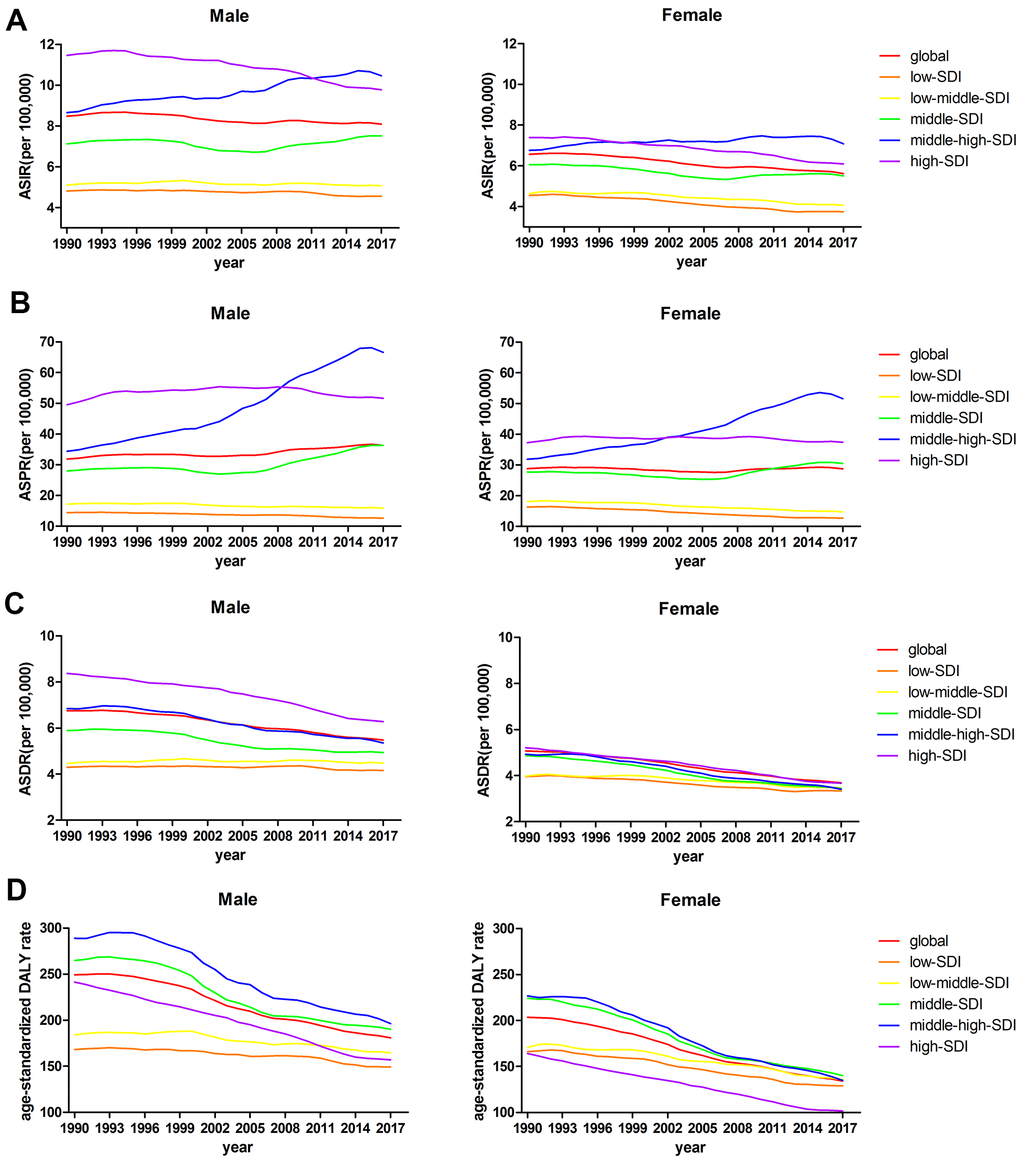
Figure 3.
(
A
) ASIRs, (
B
) ASPRs, (
C
) ASDRs, and (
D
) age-standardized DALY rates from 1990 to 2017 by sex.