Submit an Article
Navigate
Home
Editorial Board
Editorial Policies
Current Volume
Archive
Scientific Integrity
Publication Ethics Statements
Interviews with Outstanding Authors
Newsroom
Sponsored Conferences
Podcast
Contact
Special Collections
Submit an Article
Online ISSN: 1945-4589
Research Paper
|
Volume 13, Issue 7
|
pp. 10450–10467
RIPK2 is an unfavorable prognosis marker and a potential therapeutic target in human kidney renal clear cell carcinoma
Back to article
Figure 5
(5 of 8)
−
100%
+
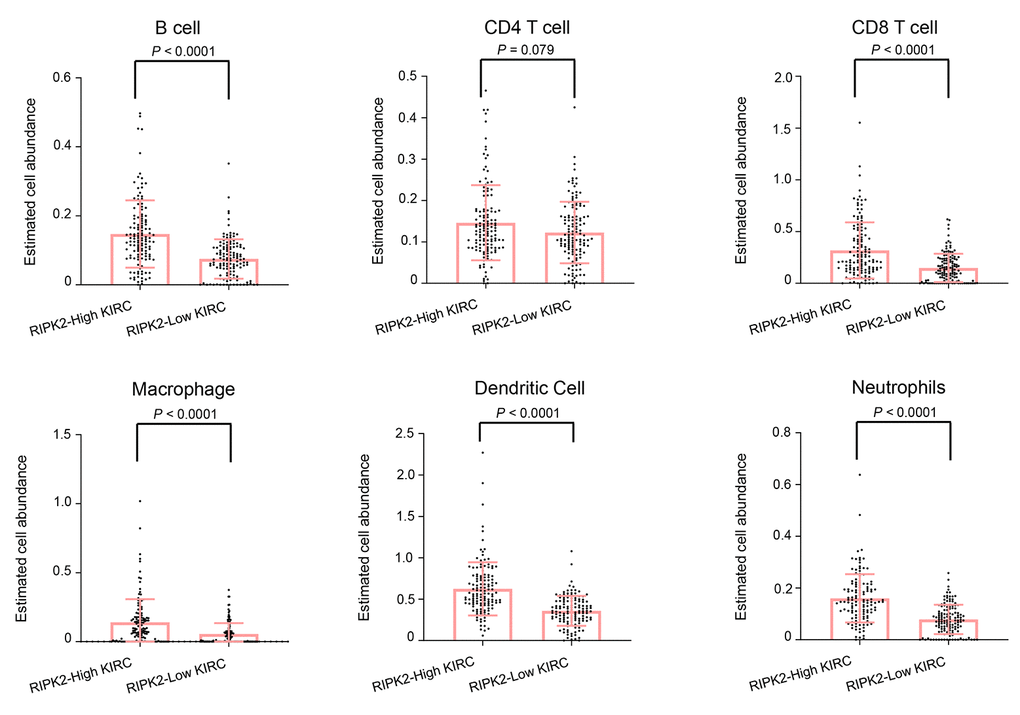
Figure 5.
The difference in estimated immune cell fraction.
Distribution plot of estimated immune cell fraction among between
RIPK2
high- and low- expression samples. Statistical significance was determined by the Wilcoxon rank-sum test.