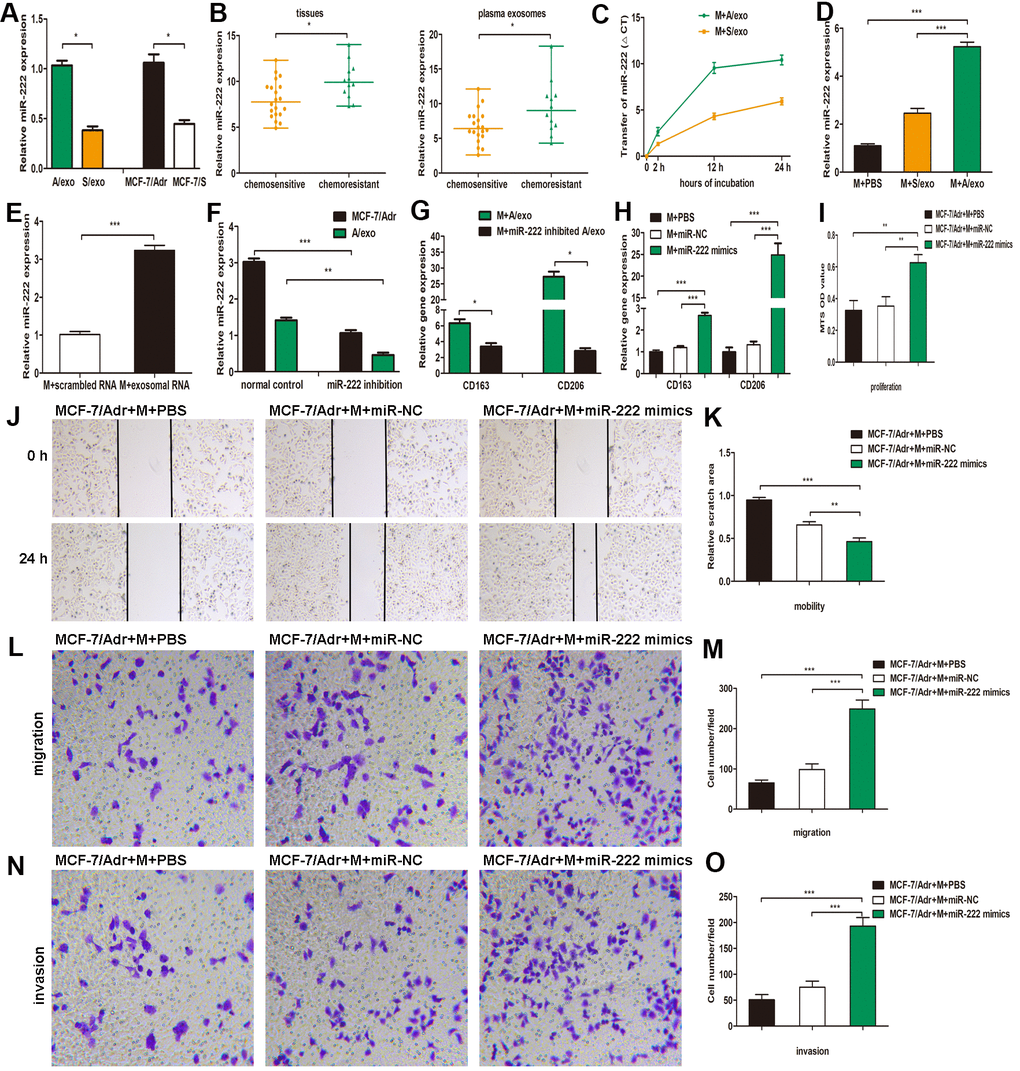
Figure 3.A/exo deliver exosomal miR-222 to macrophages and promote BCa progression via macrophages M2 polarization. (A) Relative miR-222 expression in A/exo and S/exo was analyzed by PCR. (B) Relative miR-222 expression in tissues and plasma-derived exosomes from 20 chemosensitive patients and 12 chemoresistant patients was analyzed by PCR. Data are shown as median ± range. (C) Macrophages (M) were incubated with A/exo or S/exo for 0, 2h, 12h, and 24 h and transfer of miR-222 was determined by PCR. Time point 0 stands for macrophages without exosomes. Positive values indicate transfer of miRNA. (D) Relative miR-222 expression in macrophages treated with PBS, and S/exo or A/exo for 48 h was analyzed by PCR. (E) Relative miR-222 expression in macrophages transfected with total scrambled RNA or total RNA extracted from A/exo for 48 h was evaluated by PCR. (F) Relative miR-222 expression in MCF-7/Adr and A/exo after miR-222 inhibition. (G) Relative expressions of CD163 and CD206 in macrophages incubated with A/exo, or A/exo from miR-222 inhibited MCF-7/Adr for 48 h were analyzed by PCR. (H) Macrophages were transfected with PBS, miR-negative control (miR-NC), or miR-222 mimics for 48 h. Relative expressions of CD163 and CD206 were analyzed by PCR. (I) Cell proliferation of MCF-7/Adr was assessed using the MTS viability assay, and quantitative evaluation of OD values were shown. (J) Cell mobility of MCF-7/Adr was observed using the wound-healing assay, and representative images of scratch area were shown. (K) Quantitative evaluation of scratch area. (L) Cell migration of MCF-7/Adr was evaluated using the transwell assay, and representative images of migrated cells were shown. (M) Quantitative evaluation of migrated cells. (N) Cell invasion of MCF-7/Adr was evaluated using the transwell assay, and representative images of invaded cells were shown. (O) Quantitative evaluation of migrated cells. Data are shown as mean ± SD, n = 3 independent experiments; * P<0.05, ** P<0.01, and *** P<0.001 compared with controls.