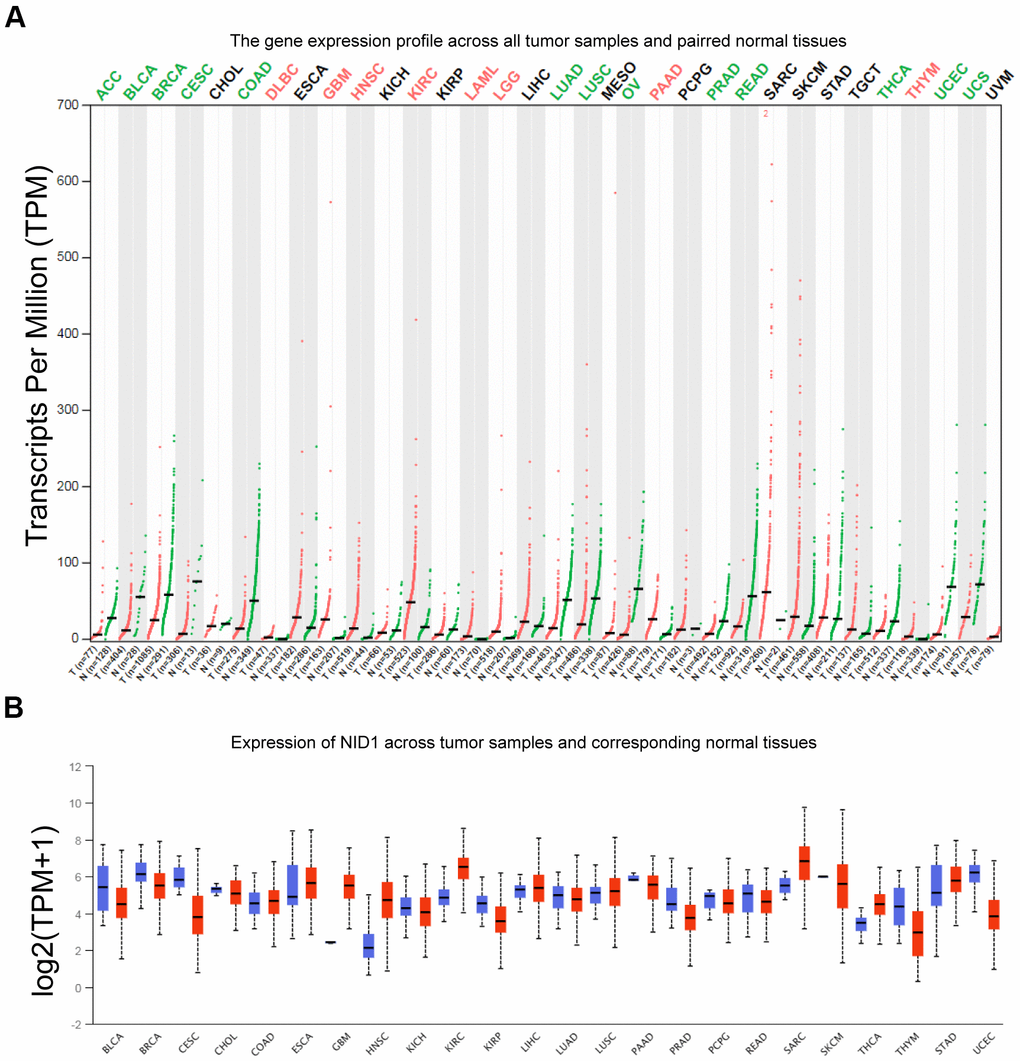
Figure 2.NID1 expression in pan-cancer tissues from GEPIA and UACLAN databases. (A) NID1 transcript levels in paired tumor and normal tissue samples from the GEPIA database. Red dots represent NID1 expression in tumor samples; green dots indicate NID1 expression in the corresponding normal tissues; black line indicates median NID1 expression; tumor names highlighted in green indicate NID1 downregulation; tumor names highlighted in red indicate NID1 upregulation; tumor names highlighted in black indicate normal NID1 expression; T= tumor tissue; N= normal tissue. (B) Validation of NID1 expression levels in different cancers from the UALCAN database. The red boxes represent NID1 expression in tumor tissues and blue boxes represent NID1 expression in the corresponding normal tissues.