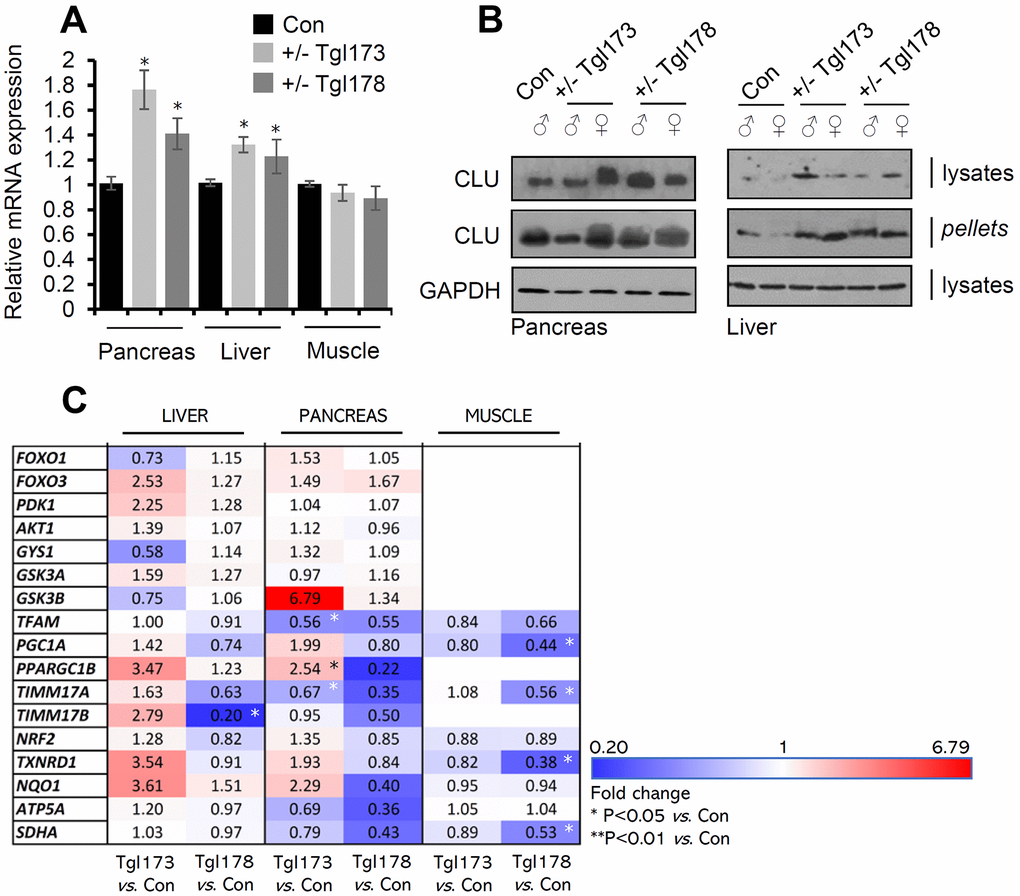
Figure 3.CLU is overexpressed in the pancreas and liver of TgI173, TgI178 (pancreas-targeted CLU OE) mice. (A) Relative clu mRNA expression levels (vs. control; littermate non-Tg animals) in the pancreas, liver, and muscle of TgI173 (+/-), TgI178 (+/-) animals. (B) Representative immunoblot analyses of shown Tg (or not) animals’ tissues samples [whole cell lysates and cell membranes (pellets)] probed with a CLU antibody; GAPDH was used as a reference. (C) Heat map indicating relative expression levels of shown genes in isolated liver, pancreas, and muscle tissues of TgI173 and TgI178 Tg vs. control (Con; littermate non-Tg) mice. Error bars ± SD (n=4-5 per mouse genotype); *P<0.05 (Tg lines vs. control). Statistical analyses (i.e., Pearson Correlation r and F significance) of data shown in Figure 3C are reported in Supplementary Table 3.